8.4.2 Module 8 Quiz – Introduction to Tableau Exam Answers
8.4.2 Module 8 Quiz – Introduction to Tableau Exam Answers Full 100% | Data Analytics Essentials 2025
Tableau is a leading data visualization tool that transforms raw data into interactive and insightful visuals, and Module 8 Quiz – Introduction to Tableau provides a comprehensive introduction to its features. This module covers essential topics such as connecting to data sources, creating basic visualizations, and designing dashboards. By mastering these concepts, learners can effectively present data-driven insights and make informed decisions. Use this guide to achieve a perfect score and enhance your proficiency in Tableau, an indispensable tool for modern data analysts and professionals looking to communicate data effectively.
-
Your company has tasked you with learning about the features and benefits of using Tableau as a business intelligence tool. From your research, what are two use cases best suited for Tableau? (Choose two.)
- combining charts to build interactive dashboards
- displaying data in a tabular format
- managing and querying relational databases
- creating meaningful data visualizations
- generating computational solutions using formulas and built-in functions
Answers Explanation & Hints: Tableau is a data visualization program and is great for creating meaningful data visualizations and for building interactive dashboards. Excel is a spreadsheet program and is good at displaying data in tabular format and for generating computational solutions using formulas and built-in functions. SQL is a programming language used to manage use relational databases.
-
Which area in the Tableau window is used to change the visual elements of a visualization to make it clearer or more impactful?
- Marks
- Filters
- Columns
- Pages
Answers Explanation & Hints: The Marks pane is where you can change visual elements of the visualization to make it clearer or more impactful.
-
You are performing data analysis on a dataset and are unsure on how to perform certain tasks using Tableau Public. Under which tab could you find how-to-videos to help complete these tasks?
- Discover
- Resources
- Vizzes
- Blog
Answers Explanation & Hints: The Resources tab contains How-to-Videos, sample data, and community resources.
-
What term is used in Tableau to refer to visualizations?
- graphs
- charts
- infographics
- vizzes
Answers Explanation & Hints: Tableau uses the term viz for singular and vizzes for plural when referring to visualizations.
-
What two options are available to connect to specific online data stores when creating a Viz in Tableau Public? (Choose two)
- OData
- JSON files
- Google Drive
- MySQL
- PDF files
Answers Explanation & Hints: Tableau Public provides two data connectors, Google Drive and OData. The other connectors are available for Tableau Desktop.
-
How does the Show Me button in Tableau Public identify the recommended chart type for the uploaded data?
- yellow highlight
- red border
- bold text
- magnified image
Answers Explanation & Hints: Clicking the Show Me button in Tableau Public displays available charts. Charts that are grayed out are not recommended for the data that was uploaded. Charts that could be used based on the uploaded data will have enhanced color while the recommended (or best) chart type will have a red border.
-
What is the maximum number of views or sheets that can be added to a Tableau dashboard?
- 4
- unlimited
- 5
- 8
Answers Explanation & Hints: There is no limit to number of views or sheets that can be added into a dashboard.
-
Match the Tableau product with the description.
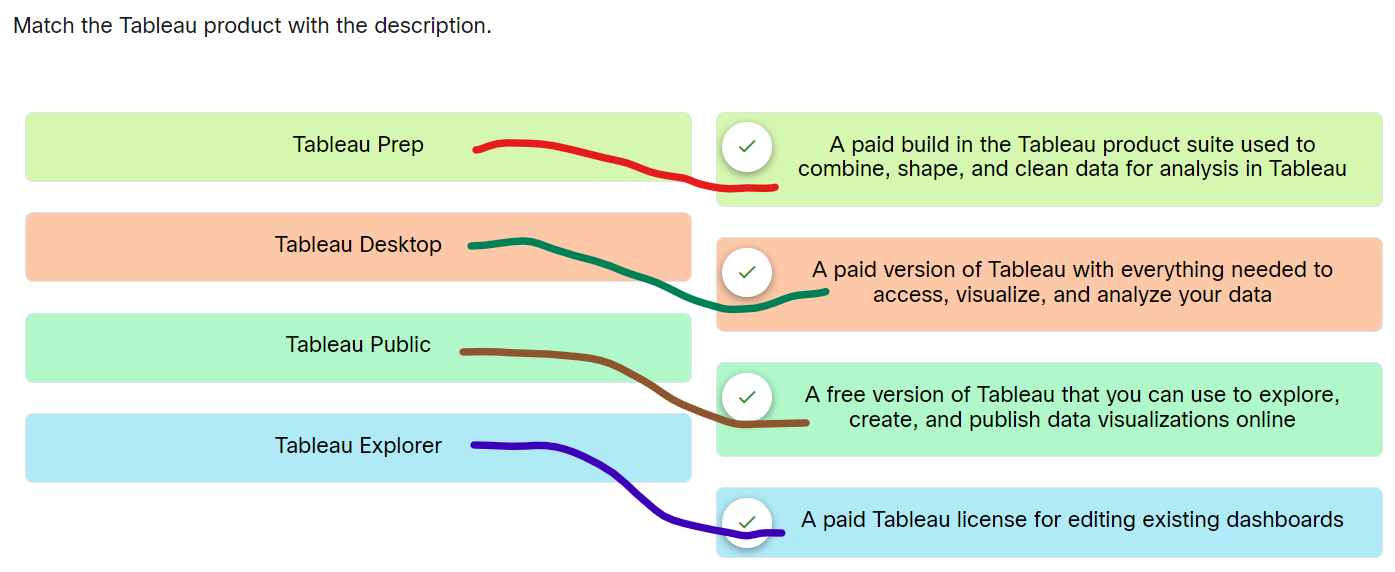
Module 8 Quiz – Introduction to Tableau Exam Answers 01 - Tableau Prep ==> A paid build in the Tableau product suite used to combine, shape, and clean data for analysis in Tableau
- Tableau Desktop ==> A paid version of Tableau with everything needed to access, visualize, and analyze your data
- Tableau Public ==> A free version of Tableau that you can use to explore, create, and publish data visualizations online
- Tableau Explorer ==> A paid Tableau license for editing existing dashboards
Answers Explanation & Hints: Place the options in the following order:
Tableau Public A free version of Tableau that you can use to explore, create, and publish data visualizations online Tableau Desktop A paid version of Tableau with everything needed to access, visualize, and analyze your data Tableau Explorer A paid Tableau license for editing existing dashboards Tableau Prep A paid build in the Tableau product suite used to combine, shape, and clean data for analysis in Tableau
-
Match the Tableau profile page tab with the respective content.
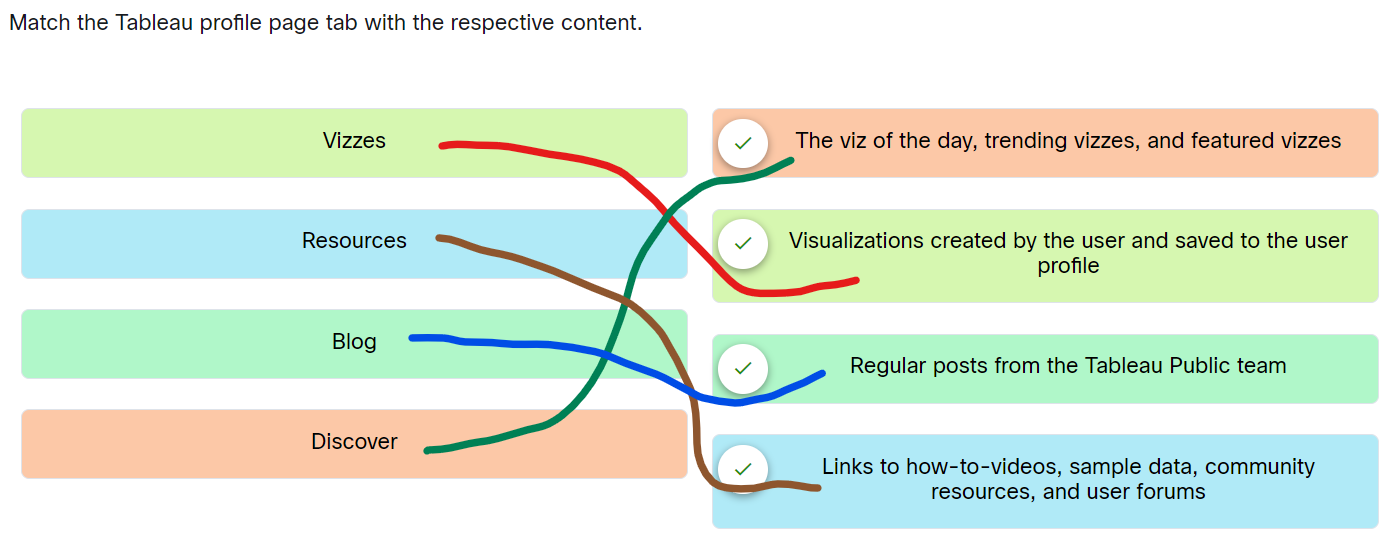
Module 8 Quiz – Introduction to Tableau Exam Answers 02 - Vizzes ==> Visualizations created by the user and saved to the user profile
- Resources ==> Links to how-to-videos, sample data, community resources, and user forums
- Blog ==> Regular posts from the Tableau Public team
- Discover ==> The viz of the day, trending vizzes, and featured vizzes
Answers Explanation & Hints: Place the options in the following order:
Blog Regular posts from the Tableau Public team Discover The viz of the day, trending vizzes, and featured vizzes Resources Links to how-to-videos, sample data, community resources, and user forums Vizzes Visualizations created by the user and saved to the user profile