AZ-400 : Microsoft Azure DevOps Solutions : Part 01
AZ-400 : Microsoft Azure DevOps Solutions : Part 01
-
DRAG DROP
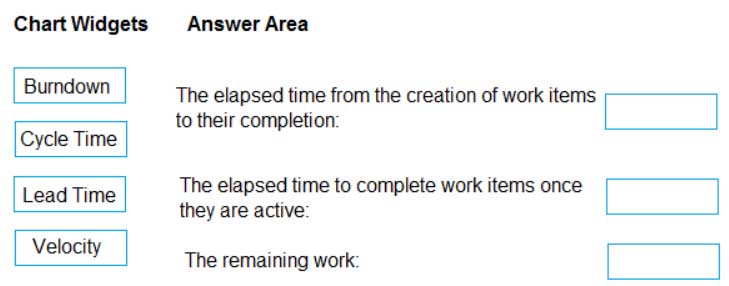
You need to recommend project metrics for dashboards in Azure DevOps.
Which chart widgets should you recommend for each metric? To answer, drag the appropriate chart widgets to the correct metrics. Each chart widget may be used once, more than once, or not at all. You may need to drag the split bar between panes or scroll to view content.
NOTE: Each correct selection is worth one point.
AZ-400 Microsoft Azure DevOps Solutions Part 01 Q01 001 Question 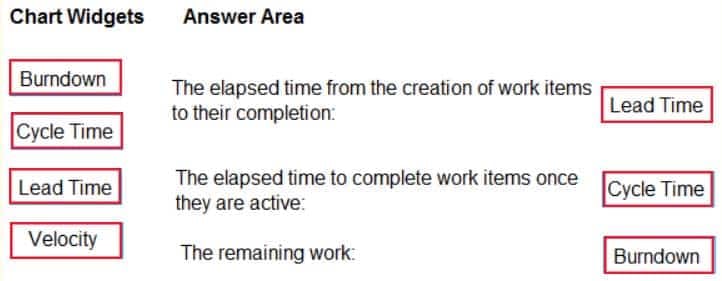
AZ-400 Microsoft Azure DevOps Solutions Part 01 Q01 001 Answer Explanation:Box 1: Lead time
Lead time measures the total time elapsed from the creation of work items to their completion.Box 2: Cycle time
Cycle time measures the time it takes for your team to complete work items once they begin actively working on them.Box 3: Burndown
Burndown charts focus on remaining work within a specific time period.Incorrect Answers:
Velocity provides a useful metric for these activities:
Support sprint planning
Forecast future sprints and the backlog items that can be completed
A guide for determining how well the team estimates and meets their planned commitments -
HOTSPOT
You plan to create alerts that will be triggered based on the page load performance of a home page.
You have the Application Insights log query shown in the following exhibit.

AZ-400 Microsoft Azure DevOps Solutions Part 01 Q02 002 Use the drop-down menus to select the answer choice that completes each statement based on the information presented in the graphic.
NOTE: Each correct selection is worth one point.

AZ-400 Microsoft Azure DevOps Solutions Part 01 Q02 003 Question 
AZ-400 Microsoft Azure DevOps Solutions Part 01 Q02 003 Answer Explanation:Box 1: percentile_duration_95
Box 2: success
For example –
requests
| project name, url, success
| where success == “False”
This will return all the failed requests in my App Insights within the specified time range. -
You manage an Azure web app that supports an e-commerce website.
You need to increase the logging level when the web app exceeds normal usage patterns. The solution must minimize administrative overhead.
Which two resources should you include in the solution? Each correct answer presents part of the solution.
NOTE: Each correct selection is worth one point.
- an Azure Automation runbook
- an Azure Monitor alert that has a dynamic threshold
- an Azure Monitor alert that has a static threshold
- the Azure Monitor autoscale settings
- an Azure Monitor alert that uses an action group that has an email action
Explanation:B: Metric Alert with Dynamic Thresholds detection leverages advanced machine learning (ML) to learn metrics’ historical behavior, identify patterns and anomalies that indicate possible service issues. It provides support of both a simple UI and operations at scale by allowing users to configure alert rules through the Azure Resource Manager API, in a fully automated manner.
A: You can use Azure Monitor to monitor base-level metrics and logs for most services in Azure. You can call Azure Automation runbooks by using action groups or by using classic alerts to automate tasks based on alerts.
-
HOTSPOT
You have an Azure Kubernetes Service (AKS) pod.
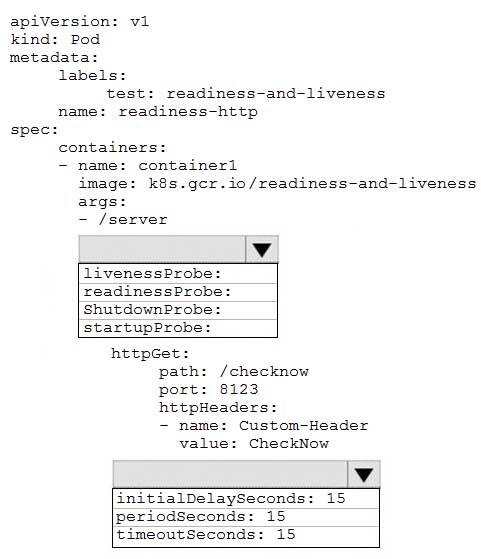
You need to configure a probe to perform the following actions:
- Confirm that the pod is responding to service requests.
– Check the status of the pod four times a minute.
– Initiate a shutdown if the pod is unresponsive.How should you complete the YAML configuration file? To answer, select the appropriate options in the answer area.
NOTE: Each correct selection is worth one point.
AZ-400 Microsoft Azure DevOps Solutions Part 01 Q04 004 Question 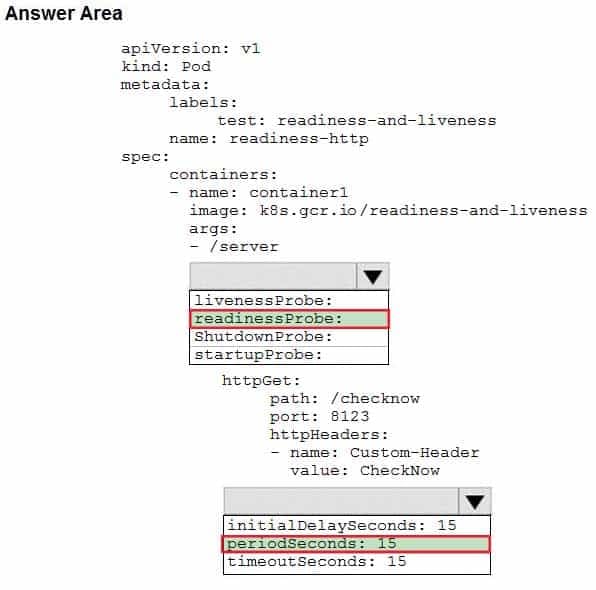
AZ-400 Microsoft Azure DevOps Solutions Part 01 Q04 004 Answer Explanation:Box 1: readinessProbe:
For containerized applications that serve traffic, you might want to verify that your container is ready to handle incoming requests. Azure Container Instances supports readiness probes to include configurations so that your container can’t be accessed under certain conditions.Incorrect Answers:
livenessProbe: Containerized applications may run for extended periods of time, resulting in broken states that may need to be repaired by restarting the container. Azure Container Instances supports liveness probes so that you can configure your containers within your container group to restart if critical functionality is not working.Box 2: periodSeconds: 15
The periodSeconds property designates the readiness command should execute every 15 seconds. -
You have a Microsoft ASP.NET Core web app in Azure that is accessed worldwide.
You need to run a URL ping test once every five minutes and create an alert when the web app is unavailable from specific Azure regions. The solution must minimize development time.
What should you do?
- Create an Azure Monitor Availability metric and alert.
- Create an Azure Application Insights availability test and alert.
- Write an Azure function and deploy the function to the specific regions.
- Create an Azure Service Health alert for the specific regions.
Explanation:There are three types of Application Insights availability tests:
– URL ping test: a simple test that you can create in the Azure portal.
– Multi-step web test
– Custom Track Availability TestsNote: After you’ve deployed your web app/website, you can set up recurring tests to monitor availability and responsiveness. Azure Application Insights sends web requests to your application at regular intervals from points around the world. It can alert you if your application isn’t responding, or if it responds too slowly.
You can set up availability tests for any HTTP or HTTPS endpoint that is accessible from the public internet. You don’t have to make any changes to the website you’re testing. In fact, it doesn’t even have to be a site you own. You can test the availability of a REST API that your service depends on.
-
You have a multi-tier application. The front end of the application is hosted in Azure App Service.
You need to identify the average load times of the application pages.
What should you use?
- Azure Application Insights
- the activity log of the App Service
- the diagnostics logs of the App Service
- Azure Advisor
Explanation:Application Insights will tell you about any performance issues and exceptions, and help you find and diagnose the root causes.
Application Insights can monitor both Java and ASP.NET web applications and services, WCF services. They can be hosted on-premises, on virtual machines, or as Microsoft Azure websites.
On the client side, Application Insights can take telemetry from web pages and a wide variety of devices including iOS, Android, and Windows Store apps.
-
SIMULATION
You need to create an instance of Azure Application Insights named az400-9940427-main and configure the instance to receive telemetry data from an Azure web app named az400-9940427-main.
To complete this task, sign in to the Microsoft Azure portal.
- See explanation below.
Explanation:Step 1: Create an instance of Azure Application Insights
1. Open Microsoft Azure Portal
2. Log into your Azure account, Select Create a resource > Developer tools > Application Insights.
AZ-400 Microsoft Azure DevOps Solutions Part 01 Q07 005 3. Enter the following settings, and then select Review + create.
Name: az400-9940427-mainStep 2: Configure App Insights SDK
1. Open your ASP.NET Core Web App project in Visual Studio > Right-click on the AppName in the Solution Explorer > Select Add > Application Insights Telemetry.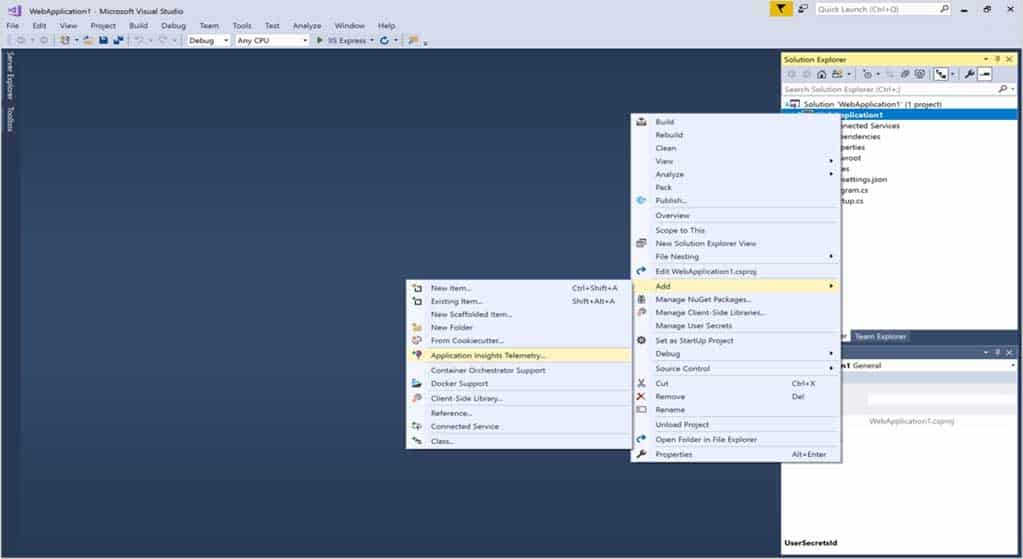
AZ-400 Microsoft Azure DevOps Solutions Part 01 Q07 006 2. Click the Get Started button
3. Select your account and subscription > Select the Existing resource you created in the Azure portal > Click Register. -
Your company uses ServiceNow for incident management.
You develop an application that runs on Azure.
The company needs to generate a ticket in ServiceNow when the application fails to authenticate.
Which Azure Log Analytics solution should you use?
- Application Insights Connector
- Automation & Control
- IT Service Management Connector (ITSM)
- Insight & Analytics
Explanation:The IT Service Management Connector (ITSMC) allows you to connect Azure and a supported IT Service Management (ITSM) product/service.
ITSMC supports connections with the following ITSM tools:
– ServiceNow
– System Center Service Manager
– Provance
– CherwellWith ITSMC, you can
– Create work items in ITSM tool, based on your Azure alerts (metric alerts, Activity Log alerts and Log Analytics alerts).
– Optionally, you can sync your incident and change request data from your ITSM tool to an Azure Log Analytics workspace. -
HOTSPOT
Your company is building a new web application.
You plan to collect feedback from pilot users on the features being delivered.
All the pilot users have a corporate computer that has Google Chrome and the Microsoft Test & Feedback extension installed. The pilot users will test the application by using Chrome.
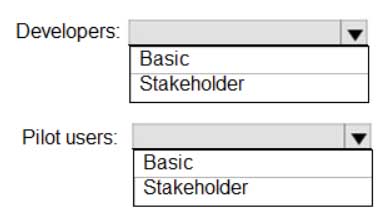
You need to identify which access levels are required to ensure that developers can request and gather feedback from the pilot users. The solution must use the principle of least privilege.
Which access levels in Azure DevOps should you identify? To answer, select the appropriate options in the answer area.
NOTE: Each correct selection is worth one point.
AZ-400 Microsoft Azure DevOps Solutions Part 01 Q09 007 Question 
AZ-400 Microsoft Azure DevOps Solutions Part 01 Q09 007 Answer Explanation:Box 1: Basic
Assign Basic to users with a TFS CAL, with a Visual Studio Professional subscription, and to users for whom you are paying for Azure Boards & Repos in an organization.Box 2: Stakeholder
Assign Stakeholders to users with no license or subscriptions who need access to a limited set of features.Note:
You assign users or groups of users to one of the following access levels:Basic: provides access to most features
VS Enterprise: provides access to premium features
Stakeholders: provides partial access, can be assigned to unlimited users for free -
You use Azure SQL Database Intelligent Insights and Azure Application Insights for monitoring.
You need to write ad-hoc queries against the monitoring data.
Which query language should you use?
- Kusto Query Language (KQL)
- PL/pgSQL
- PL/SQL
- Transact-SQL
Explanation:
Azure Monitor Logs is based on Azure Data Explorer, and log queries are written using the same Kusto query language (KQL). This is a rich language designed to be easy to read and author, and you should be able to start using it with minimal guidance. -
Your company creates a web application.
You need to recommend a solution that automatically sends to Microsoft Teams a daily summary of the exceptions that occur in the application.
Which two Azure services should you recommend? Each correct answer presents part of the solution.
NOTE: Each correct selection is worth one point.
- Azure Logic Apps
- Azure Pipelines
- Microsoft Visual Studio App Center
- Azure DevOps Project
- Azure Application Insights
Explanation:E: Exceptions in your live web app are reported by Application Insights.
Note: Periodical reports help keep a team informed on how their business critical services are doing. Developers, DevOps/SRE teams, and their managers can be productive with automated reports reliably delivering insights without requiring everyone to sign in the portal. Such reports can also help identify gradual increases in latencies, load or failure rates that may not trigger any alert rules.
A: You can programmatically query Application Insights data to generate custom reports on a schedule. The following options can help you get started quickly:
– Automate reports with Microsoft Flow
– Automate reports with Logic Apps -
DRAG DROP
Your company wants to use Azure Application Insights to understand how user behaviors affect an application.
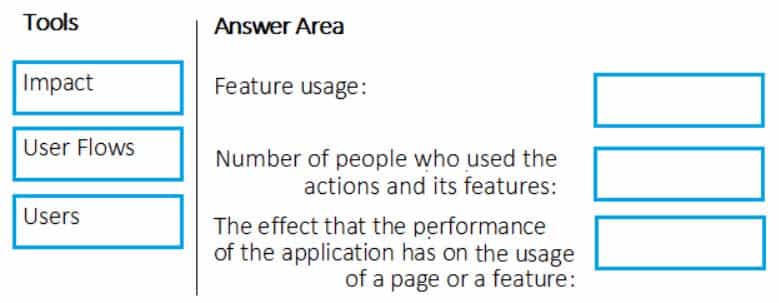
Which Application Insights tool should you use to analyze each behavior? To answer, drag the appropriate tools to the correct behaviors. Each tool may be used once, more than once, or not at all. You may need to drag the split bar between panes or scroll to view content.
NOTE: Each correct selection is worth one point.
AZ-400 Microsoft Azure DevOps Solutions Part 01 Q12 008 Question 
AZ-400 Microsoft Azure DevOps Solutions Part 01 Q12 008 Answer Explanation:Box 1: User Flows
The User Flows tool visualizes how users navigate between the pages and features of your site. It’s great for answering questions like:How do users navigate away from a page on your site?
What do users click on a page on your site?
Where are the places that users churn most from your site?
Are there places where users repeat the same action over and over?Box 2: Users
Counting Users: The user behavior analytics tools don’t currently support counting users or sessions based on properties other than anonymous user ID, authenticated user ID, or session ID.Box 3: Impact
Impact analyzes how load times and other properties influence conversion rates for various parts of your app. To put it more precisely, it discovers how any dimension of a page view, custom event, or request affects the usage of a different page view or custom event. -
Your company is building a mobile app that targets Android and iOS devices.
Your team uses Azure DevOps to manage all work items and release cycles.
You need to recommend a solution to perform the following tasks:
– Collect crash reports for issue analysis.
– Distribute beta releases to your testers.
– Get user feedback on the functionality of new apps.What should you include in the recommendation?
- the Microsoft Test & Feedback extension
- Microsoft Visual Studio App Center integration
- Azure Application Insights widgets
- Jenkins integration
Explanation:The “Exploratory Testing” extension is now “Test & Feedback” and is now Generally Available.
Anyone can now test web apps and give feedback, all directly from the browser on any platform: Windows, Mac, or Linux. Available for Google Chrome and Mozilla Firefox (required version 50.0 or above) currently. Support for Microsoft Edge is in the pipeline and will be enabled once Edge moves to a Chromium-compatible web platform.
-
You have an Azure DevOps project named Project1 and an Azure subscription named Sub1. Sub1 contains an Azure virtual machine scale set named VMSS1. VMSS1 hosts a web application named WebApp1. WebApp1 uses stateful sessions.
The WebApp1 installation is managed by using the Custom Script extension. The script resides in an Azure Storage account named sa1.
You plan to make a minor change to a UI element of WebApp1 and to gather user feedback about the change.
You need to implement limited user testing for the new version of WebApp1 on VMSS1.
Which three actions should you perform? Each correct answer presents part of the solution.
NOTE: Each correct selection is worth one point.
- Modify the load balancer settings of VMSS1.
- Redeploy VMSS1.
- Upload a custom script file to sa1.
- Modify the Custom Script extension settings of VMSS1.
- Update the configuration of a virtual machine in VMSS1.
-
SIMULATION
You need to create a notification if the peak average response time of an Azure web app named az400-9940427-main is more than five seconds when evaluated during a five-minute period. The notification must trigger the “https://contoso.com/notify” webhook.
To complete this task, sign in to the Microsoft Azure portal.
- See explanation below.
Explanation:1. Open Microsoft Azure Portal
2. Log into your Azure account and go to App Service and look under Monitoring then you will see Alert.
3. Select Add an alert rule
4. Configure the alert rule as per below and click Ok.
Source: Alert on Metrics
Resource Group: az400-9940427-main
Resource: az400-9940427-main
Threshold: 5
Period: Over the last 5 minutes
Webhook: https://contoso.com/notify
AZ-400 Microsoft Azure DevOps Solutions Part 01 Q15 009 -
SIMULATION
You need to create and configure an Azure Storage account named az400lod11566895stor in a resource group named RG1lod11566895 to store the boot diagnostics for a virtual machine named VM1.
To complete this task, sign in to the Microsoft Azure portal.
- See explanation below.
Explanation:Step 1: To create a general-purpose v2 storage account in the Azure portal, follow these steps:
On the Azure portal menu, select All services. In the list of resources, type Storage Accounts. As you begin typing, the list filters based on your input. Select Storage Accounts.
On the Storage Accounts window that appears, choose Add.
Select the subscription in which to create the storage account.
Under the Resource group field, select RG1lod11566895
Next, enter a name for your storage account named: az400lod11566895stor
Select Create.Step 2: Enable boot diagnostics on existing virtual machine
To enable Boot diagnostics on an existing virtual machine, follow these steps:Sign in to the Azure portal, and then select the virtual machine VM1.
In the Support + troubleshooting section, select Boot diagnostics, then select the Settings tab.
In Boot diagnostics settings, change the status to On, and from the Storage account drop-down list, select the storage account az400lod11566895stor.
Save the change.
AZ-400 Microsoft Azure DevOps Solutions Part 01 Q16 010 You must restart the virtual machine for the change to take effect.
-
SIMULATION
You have a web app that connects to an Azure SQL Database named db1.
You need to configure db1 to send Query Store runtime statistics to Azure Log Analytics.
To complete this task, sign in to the Microsoft Azure portal.
- See explanation below.
Explanation:To enable streaming of diagnostic telemetry for a single or a pooled database, follow these steps:
1. Go to Azure SQL database resource.
2. Select Diagnostics settings.
3. Select Turn on diagnostics if no previous settings exist, or select Edit setting to edit a previous setting. You can create up to three parallel connections to stream diagnostic telemetry.
4. Select Add diagnostic setting to configure parallel streaming of diagnostics data to multiple resources.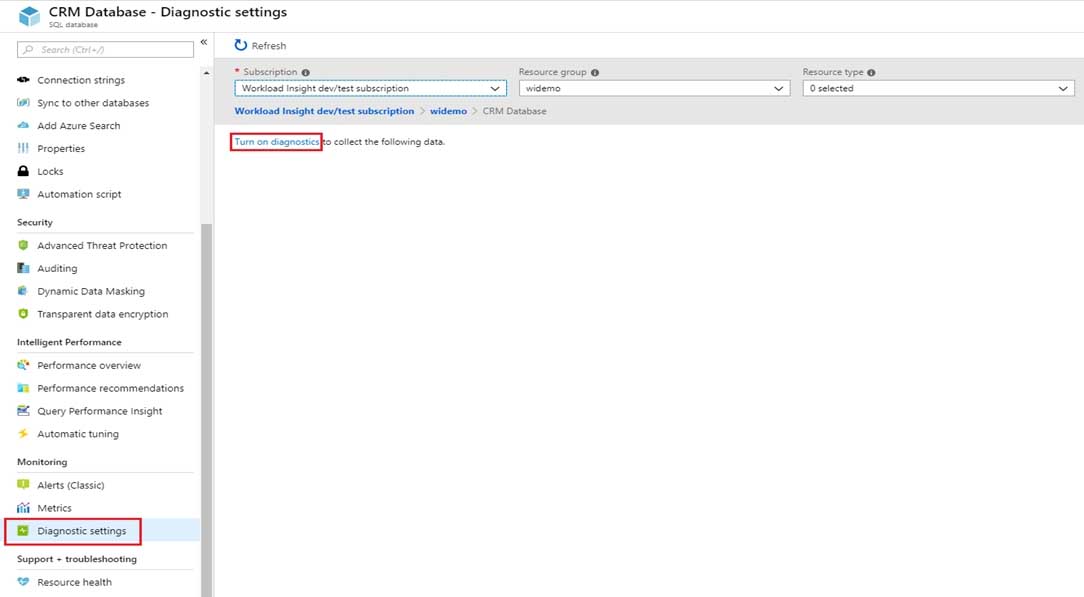
AZ-400 Microsoft Azure DevOps Solutions Part 01 Q17 011 5. Enter a setting name for your own reference.
6. Select a destination resource for the streaming diagnostics data: Archive to storage account, Stream to an event hub, or Send to Log Analytics.
7. For the standard, event-based monitoring experience, select the following check boxes for database diagnostics log telemetry: QueryStoreRuntimeStatistics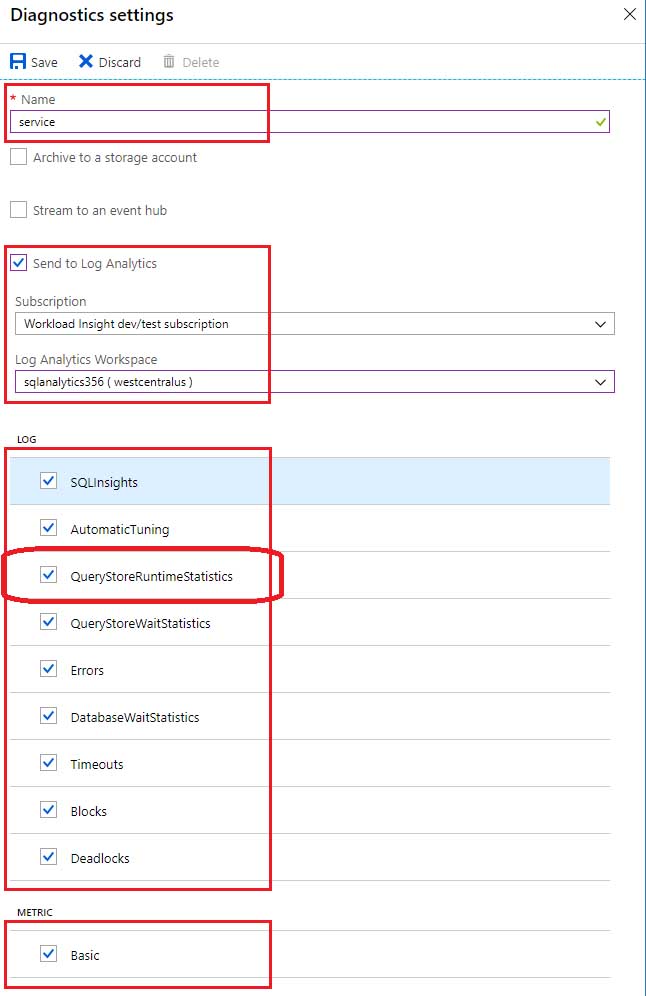
AZ-400 Microsoft Azure DevOps Solutions Part 01 Q17 012 8. For an advanced, one-minute-based monitoring experience, select the check box for Basic metrics.
9. Select Save. -
DRAG DROP
You have several Azure virtual machines that run Windows Server 2019.
You need to identify the distinct event IDs of each virtual machine as shown in the following table.

AZ-400 Microsoft Azure DevOps Solutions Part 01 Q18 013 How should you complete the Azure Monitor query? To answer, drag the appropriate values to the correct locations. Each value may be used once, more than once, or not at all. You may need to drag the split bar between panes or scroll to view content.
NOTE: Each correct selection is worth one point.
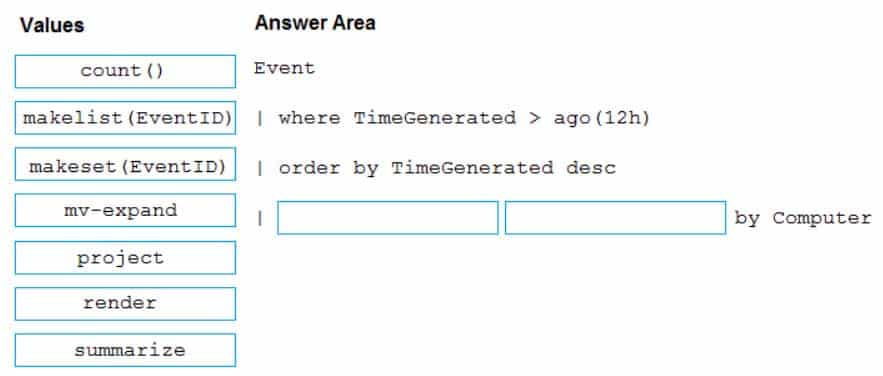
AZ-400 Microsoft Azure DevOps Solutions Part 01 Q18 014 Question 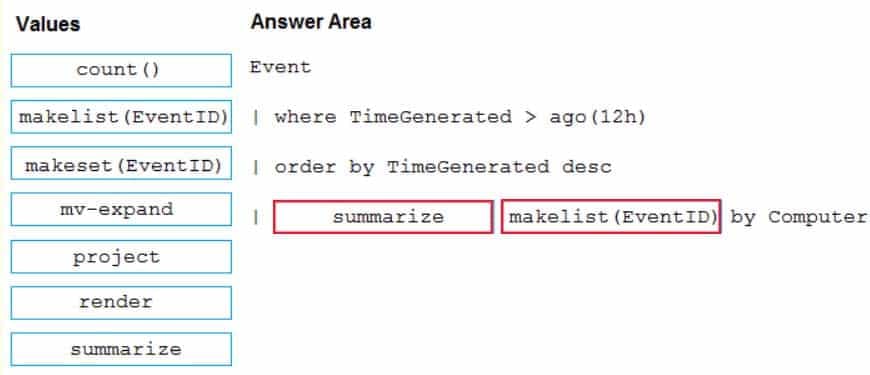
AZ-400 Microsoft Azure DevOps Solutions Part 01 Q18 014 Answer Explanation:You can use makelist to pivot data by the order of values in a particular column. For example, you may want to explore the most common order events take place on your machines. You can essentially pivot the data by the order of EventIDs on each machine.
Example:
Event
| where TimeGenerated > ago(12h)
| order by TimeGenerated desc
| summarize makelist(EventID) by Computer -
HOTSPOT
You have an Azure web app named Webapp1.
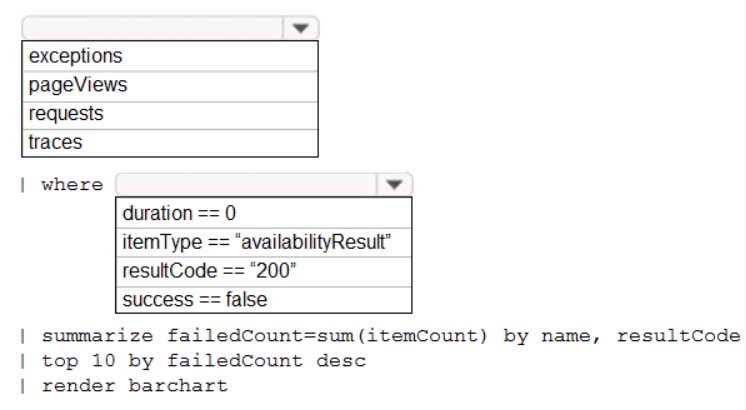
You need to use an Azure Monitor query to create a report that details the top 10 pages of Webapp1 that failed.
How should you complete the query? To answer, select the appropriate options in the answer area.
NOTE: Each correct selection is worth one point.
AZ-400 Microsoft Azure DevOps Solutions Part 01 Q19 015 Question 
AZ-400 Microsoft Azure DevOps Solutions Part 01 Q19 015 Answer Explanation:Box 1: requests
Failed requests (requests/failed):
The count of tracked server requests that were marked as failed.
Kusto code:
requests
| where success == ‘False’Box 2: success == false
-
You are monitoring the health and performance of an Azure web app by using Azure Application Insights.
You need to ensure that an alert is sent when the web app has a sudden rise in performance issues and failures.
What should you use?
- custom events
- Application Insights Profiler
- usage analysis
- Smart Detection
- Continuous export
Explanation:
Smart Detection automatically warns you of potential performance problems and failure anomalies in your web application. It performs proactive analysis of the telemetry that your app sends to Application Insights. If there is a sudden rise in failure rates, or abnormal patterns in client or server performance, you get an alert.