DP-203 : Data Engineering on Microsoft Azure : Part 02
DP-203 : Data Engineering on Microsoft Azure : Part 02
-
You plan to implement an Azure Data Lake Gen 2 storage account.
You need to ensure that the data lake will remain available if a data center fails in the primary Azure region. The solution must minimize costs.
Which type of replication should you use for the storage account?
- geo-redundant storage (GRS)
- geo-zone-redundant storage (GZRS)
- locally-redundant storage (LRS)
- zone-redundant storage (ZRS)
Explanation:
Locally redundant storage (LRS) copies your data synchronously three times within a single physical location in the primary region. LRS is the least expensive replication option
-
HOTSPOT
You have a SQL pool in Azure Synapse.
You plan to load data from Azure Blob storage to a staging table. Approximately 1 million rows of data will be loaded daily. The table will be truncated before each daily load.
You need to create the staging table. The solution must minimize how long it takes to load the data to the staging table.
How should you configure the table? To answer, select the appropriate options in the answer area.
NOTE: Each correct selection is worth one point.

DP-203 Data Engineering on Microsoft Azure Part 02 Q02 026 Question 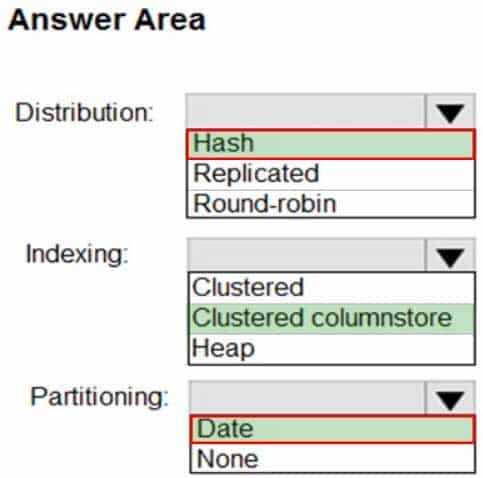
DP-203 Data Engineering on Microsoft Azure Part 02 Q02 026 Answer Explanation:Box 1: Hash
Hash-distributed tables improve query performance on large fact tables. They can have very large numbers of rows and still achieve high performance.Incorrect Answers:
Round-robin tables are useful for improving loading speed.Box 2: Clustered columnstore
When creating partitions on clustered columnstore tables, it is important to consider how many rows belong to each partition. For optimal compression and performance of clustered columnstore tables, a minimum of 1 million rows per distribution and partition is needed.Box 3: Date
Table partitions enable you to divide your data into smaller groups of data. In most cases, table partitions are created on a date column.
Partition switching can be used to quickly remove or replace a section of a table. -
You are designing a fact table named FactPurchase in an Azure Synapse Analytics dedicated SQL pool. The table contains purchases from suppliers for a retail store. FactPurchase will contain the following columns.
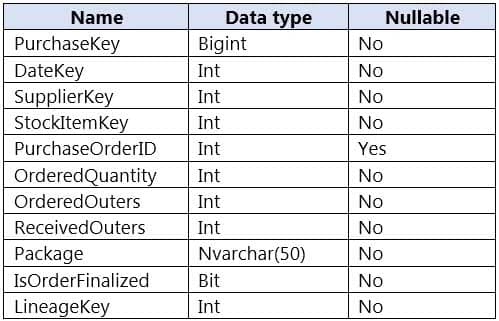
DP-203 Data Engineering on Microsoft Azure Part 02 Q03 027 FactPurchase will have 1 million rows of data added daily and will contain three years of data.
Transact-SQL queries similar to the following query will be executed daily.
SELECT
SupplierKey, StockItemKey, IsOrderFinalized, COUNT(*)
FROM FactPurchase
WHERE DateKey >= 20210101
AND DateKey <= 20210131
GROUP By SupplierKey, StockItemKey, IsOrderFinalized
Which table distribution will minimize query times?
- replicated
- hash-distributed on PurchaseKey
- round-robin
- hash-distributed on IsOrderFinalized
Explanation:Hash-distributed tables improve query performance on large fact tables.
To balance the parallel processing, select a distribution column that:
Has many unique values. The column can have duplicate values. All rows with the same value are assigned to the same distribution. Since there are 60 distributions, some distributions can have > 1 unique values while others may end with zero values.
Does not have NULLs, or has only a few NULLs.
Is not a date column.Incorrect Answers:
C: Round-robin tables are useful for improving loading speed. -
HOTSPOT
From a website analytics system, you receive data extracts about user interactions such as downloads, link clicks, form submissions, and video plays.
The data contains the following columns.
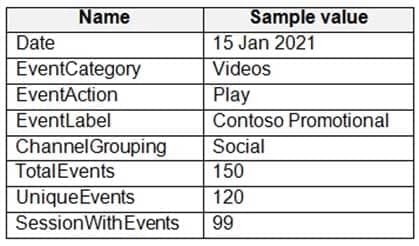
DP-203 Data Engineering on Microsoft Azure Part 02 Q04 028 You need to design a star schema to support analytical queries of the data. The star schema will contain four tables including a date dimension.
To which table should you add each column? To answer, select the appropriate options in the answer area.
NOTE: Each correct selection is worth one point.

DP-203 Data Engineering on Microsoft Azure Part 02 Q04 029 Question 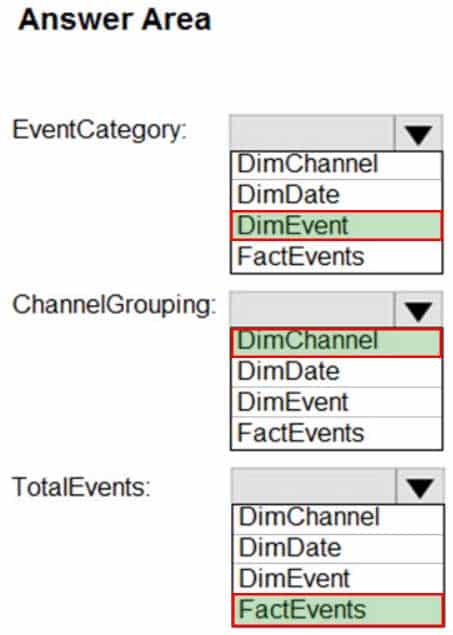
DP-203 Data Engineering on Microsoft Azure Part 02 Q04 029 Answer Explanation:Box 1: DimEvent
Box 2: DimChannel
Box 3: FactEvents
Fact tables store observations or events, and can be sales orders, stock balances, exchange rates, temperatures, etc -
Note: This question is part of a series of questions that present the same scenario. Each question in the series contains a unique solution that might meet the stated goals. Some question sets might have more than one correct solution, while others might not have a correct solution.
After you answer a question in this section, you will NOT be able to return to it. As a result, these questions will not appear in the review screen.
You have an Azure Storage account that contains 100 GB of files. The files contain rows of text and numerical values. 75% of the rows contain description data that has an average length of 1.1 MB.
You plan to copy the data from the storage account to an enterprise data warehouse in Azure Synapse Analytics.
You need to prepare the files to ensure that the data copies quickly.
Solution: You convert the files to compressed delimited text files.
Does this meet the goal?
- Yes
- No
Explanation:All file formats have different performance characteristics. For the fastest load, use compressed delimited text files. -
Note: This question is part of a series of questions that present the same scenario. Each question in the series contains a unique solution that might meet the stated goals. Some question sets might have more than one correct solution, while others might not have a correct solution.
After you answer a question in this section, you will NOT be able to return to it. As a result, these questions will not appear in the review screen.
You have an Azure Storage account that contains 100 GB of files. The files contain rows of text and numerical values. 75% of the rows contain description data that has an average length of 1.1 MB.
You plan to copy the data from the storage account to an enterprise data warehouse in Azure Synapse Analytics.
You need to prepare the files to ensure that the data copies quickly.
Solution: You copy the files to a table that has a columnstore index.
Does this meet the goal?
- Yes
- No
Explanation:
Instead convert the files to compressed delimited text files. -
Note: This question is part of a series of questions that present the same scenario. Each question in the series contains a unique solution that might meet the stated goals. Some question sets might have more than one correct solution, while others might not have a correct solution.
After you answer a question in this section, you will NOT be able to return to it. As a result, these questions will not appear in the review screen.
You have an Azure Storage account that contains 100 GB of files. The files contain rows of text and numerical values. 75% of the rows contain description data that has an average length of 1.1 MB.
You plan to copy the data from the storage account to an enterprise data warehouse in Azure Synapse Analytics.
You need to prepare the files to ensure that the data copies quickly.
Solution: You modify the files to ensure that each row is more than 1 MB.
Does this meet the goal?
- Yes
- No
Explanation:
Instead convert the files to compressed delimited text files. -
Case study
This is a case study. Case studies are not timed separately. You can use as much exam time as you would like to complete each case. However, there may be additional case studies and sections on this exam. You must manage your time to ensure that you are able to complete all questions included on this exam in the time provided.
To answer the questions included in a case study, you will need to reference information that is provided in the case study. Case studies might contain exhibits and other resources that provide more information about the scenario that is described in the case study. Each question is independent of the other questions in this case study.
At the end of this case study, a review screen will appear. This screen allows you to review your answers and to make changes before you move to the next section of the exam. After you begin a new section, you cannot return to this section.
To start the case study
To display the first question in this case study, click the Next button. Use the buttons in the left pane to explore the content of the case study before you answer the questions. Clicking these buttons displays information such as business requirements, existing environment, and problem statements. If the case study has an All Information tab, note that the information displayed is identical to the information displayed on the subsequent tabs. When you are ready to answer a question, click the Question button to return to the question.Overview
Litware, Inc. owns and operates 300 convenience stores across the US. The company sells a variety of packaged foods and drinks, as well as a variety of prepared foods, such as sandwiches and pizzas.
Litware has a loyalty club whereby members can get daily discounts on specific items by providing their membership number at checkout.
Litware employs business analysts who prefer to analyze data by using Microsoft Power BI, and data scientists who prefer analyzing data in Azure Databricks notebooks.
Requirements
Business Goals
Litware wants to create a new analytics environment in Azure to meet the following requirements:
– See inventory levels across the stores. Data must be updated as close to real time as possible.
– Execute ad hoc analytical queries on historical data to identify whether the loyalty club discounts increase sales of the discounted products.
– Every four hours, notify store employees about how many prepared food items to produce based on historical demand from the sales data.Technical Requirements
Litware identifies the following technical requirements:
– Minimize the number of different Azure services needed to achieve the business goals.
– Use platform as a service (PaaS) offerings whenever possible and avoid having to provision virtual machines that must be managed by Litware.
– Ensure that the analytical data store is accessible only to the company’s on-premises network and Azure services.
– Use Azure Active Directory (Azure AD) authentication whenever possible.
– Use the principle of least privilege when designing security.
– Stage Inventory data in Azure Data Lake Storage Gen2 before loading the data into the analytical data store. Litware wants to remove transient data from Data Lake Storage once the data is no longer in use. Files that have a modified date that is older than 14 days must be removed.
– Limit the business analysts’ access to customer contact information, such as phone numbers, because this type of data is not analytically relevant.
– Ensure that you can quickly restore a copy of the analytical data store within one hour in the event of corruption or accidental deletion.Planned Environment
Litware plans to implement the following environment:
– The application development team will create an Azure event hub to receive real-time sales data, including store number, date, time, product ID, customer loyalty number, price, and discount amount, from the point of sale (POS) system and output the data to data storage in Azure.
– Customer data, including name, contact information, and loyalty number, comes from Salesforce, a SaaS application, and can be imported into Azure once every eight hours. Row modified dates are not trusted in the source table.
– Product data, including product ID, name, and category, comes from Salesforce and can be imported into Azure once every eight hours. Row modified dates are not trusted in the source table.
– Daily inventory data comes from a Microsoft SQL server located on a private network.
– Litware currently has 5 TB of historical sales data and 100 GB of customer data. The company expects approximately 100 GB of new data per month for the next year.
– Litware will build a custom application named FoodPrep to provide store employees with the calculation results of how many prepared food items to produce every four hours.
– Litware does not plan to implement Azure ExpressRoute or a VPN between the on-premises network and Azure.-
HOTSPOT
Which Azure Data Factory components should you recommend using together to import the daily inventory data from the SQL server to Azure Data Lake Storage? To answer, select the appropriate options in the answer area.
NOTE: Each correct selection is worth one point.

DP-203 Data Engineering on Microsoft Azure Part 02 Q08 030 Question 
DP-203 Data Engineering on Microsoft Azure Part 02 Q08 030 Answer Explanation:Box 1: Self-hosted integration runtime
A self-hosted IR is capable of running copy activity between a cloud data stores and a data store in private network.Box 2: Schedule trigger
Schedule every 8 hoursBox 3: Copy activity
Scenario:
– Customer data, including name, contact information, and loyalty number, comes from Salesforce and can be imported into Azure once every eight hours. Row modified dates are not trusted in the source table.
– Product data, including product ID, name, and category, comes from Salesforce and can be imported into Azure once every eight hours. Row modified dates are not trusted in the source table.
-
-
HOTSPOT
You are building an Azure Stream Analytics job to identify how much time a user spends interacting with a feature on a webpage.
The job receives events based on user actions on the webpage. Each row of data represents an event. Each event has a type of either ‘start’ or ‘end’.
You need to calculate the duration between start and end events.
How should you complete the query? To answer, select the appropriate options in the answer area.
NOTE: Each correct selection is worth one point.

DP-203 Data Engineering on Microsoft Azure Part 02 Q09 031 Question 
DP-203 Data Engineering on Microsoft Azure Part 02 Q09 031 Answer Explanation:Box 1: DATEDIFF
DATEDIFF function returns the count (as a signed integer value) of the specified datepart boundaries crossed between the specified startdate and enddate.
Syntax: DATEDIFF ( datepart , startdate, enddate )Box 2: LAST
The LAST function can be used to retrieve the last event within a specific condition. In this example, the condition is an event of type Start, partitioning the search by PARTITION BY user and feature. This way, every user and feature is treated independently when searching for the Start event. LIMIT DURATION limits the search back in time to 1 hour between the End and Start events.Example:
SELECT
[user],
feature,
DATEDIFF(
second,
LAST(Time) OVER (PARTITION BY [user], feature LIMIT DURATION(hour,
1) WHEN Event = ‘start’),
Time) as duration
FROM input TIMESTAMP BY Time
WHERE
Event = ‘end’ -
You are creating an Azure Data Factory data flow that will ingest data from a CSV file, cast columns to specified types of data, and insert the data into a table in an Azure Synapse Analytic dedicated SQL pool. The CSV file contains three columns named username, comment, and date.
The data flow already contains the following:
– A source transformation.
– A Derived Column transformation to set the appropriate types of data.
– A sink transformation to land the data in the pool.You need to ensure that the data flow meets the following requirements:
– All valid rows must be written to the destination table.
– Truncation errors in the comment column must be avoided proactively.
– Any rows containing comment values that will cause truncation errors upon insert must be written to a file in blob storage.Which two actions should you perform? Each correct answer presents part of the solution.
NOTE: Each correct selection is worth one point.
- To the data flow, add a sink transformation to write the rows to a file in blob storage.
- To the data flow, add a Conditional Split transformation to separate the rows that will cause truncation errors.
- To the data flow, add a filter transformation to filter out rows that will cause truncation errors.
- Add a select transformation to select only the rows that will cause truncation errors.
Explanation:B: Example:
1. This conditional split transformation defines the maximum length of “title” to be five. Any row that is less than or equal to five will go into the GoodRows stream. Any row that is larger than five will go into the BadRows stream.
DP-203 Data Engineering on Microsoft Azure Part 02 Q10 032 2. This conditional split transformation defines the maximum length of “title” to be five. Any row that is less than or equal to five will go into the GoodRows stream. Any row that is larger than five will go into the BadRows stream.
A:
3. Now we need to log the rows that failed. Add a sink transformation to the BadRows stream for logging. Here, we’ll “auto-map” all of the fields so that we have logging of the complete transaction record. This is a text-delimited CSV file output to a single file in Blob Storage. We’ll call the log file “badrows.csv”.
DP-203 Data Engineering on Microsoft Azure Part 02 Q10 033 4. The completed data flow is shown below. We are now able to split off error rows to avoid the SQL truncation errors and put those entries into a log file. Meanwhile, successful rows can continue to write to our target database.

DP-203 Data Engineering on Microsoft Azure Part 02 Q10 034 -
DRAG DROP
You need to create an Azure Data Factory pipeline to process data for the following three departments at your company: Ecommerce, retail, and wholesale. The solution must ensure that data can also be processed for the entire company.
How should you complete the Data Factory data flow script? To answer, drag the appropriate values to the correct targets. Each value may be used once, more than once, or not at all. You may need to drag the split bar between panes or scroll to view content.
NOTE: Each correct selection is worth one point.

DP-203 Data Engineering on Microsoft Azure Part 02 Q11 035 Question 
DP-203 Data Engineering on Microsoft Azure Part 02 Q11 035 Answer Explanation:The conditional split transformation routes data rows to different streams based on matching conditions. The conditional split transformation is similar to a CASE decision structure in a programming language. The transformation evaluates expressions, and based on the results, directs the data row to the specified stream.
Box 1: dept==’ecommerce’, dept==’retail’, dept==’wholesale’
First we put the condition. The order must match the stream labeling we define in Box 3.Syntax:
<incomingStream>
split(
<conditionalExpression1>
<conditionalExpression2>
…
disjoint: {true | false}
) ~> <splitTx>@(stream1, stream2, …, <defaultStream>)Box 2: discount : false
disjoint is false because the data goes to the first matching condition. All remaining rows matching the third condition go to output stream all.Box 3: ecommerce, retail, wholesale, all
Label the streams -
DRAG DROP
You have an Azure Data Lake Storage Gen2 account that contains a JSON file for customers. The file contains two attributes named FirstName and LastName.
You need to copy the data from the JSON file to an Azure Synapse Analytics table by using Azure Databricks. A new column must be created that concatenates the FirstName and LastName values.
You create the following components:
– A destination table in Azure Synapse
– An Azure Blob storage container
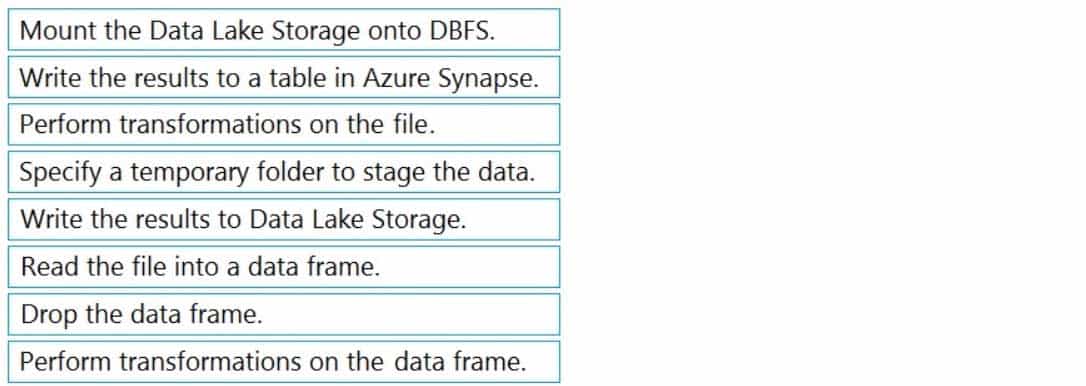
– A service principalWhich five actions should you perform in sequence next in is Databricks notebook? To answer, move the appropriate actions from the list of actions to the answer area and arrange them in the correct order.
DP-203 Data Engineering on Microsoft Azure Part 02 Q12 036 Question 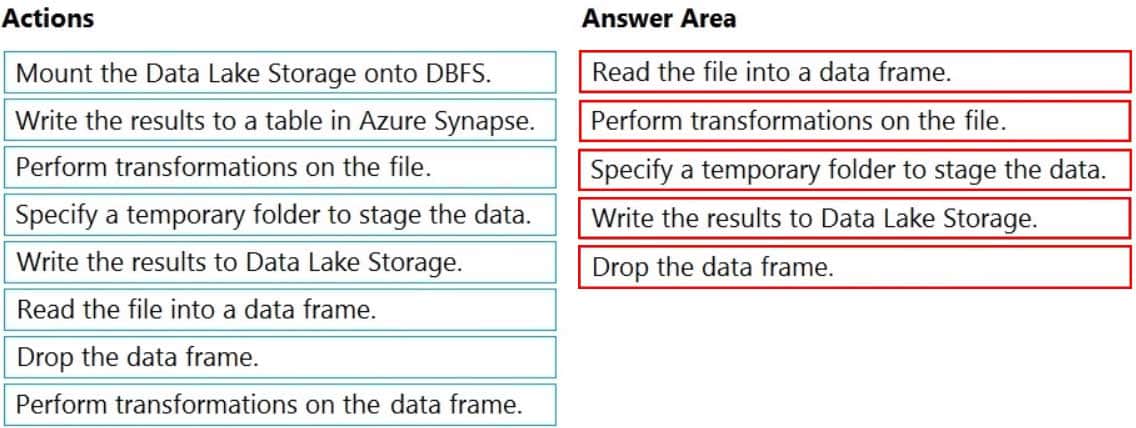
DP-203 Data Engineering on Microsoft Azure Part 02 Q12 036 Answer Explanation:Explanation:
Step 1: Read the file into a data frame.
You can load the json files as a data frame in Azure Databricks.Step 2: Perform transformations on the data frame.
Step 3:Specify a temporary folder to stage the data
Specify a temporary folder to use while moving data between Azure Databricks and Azure Synapse.Step 4: Write the results to a table in Azure Synapse.
You upload the transformed data frame into Azure Synapse. You use the Azure Synapse connector for Azure Databricks to directly upload a dataframe as a table in a Azure Synapse.Step 5: Drop the data frame
Clean up resources. You can terminate the cluster. From the Azure Databricks workspace, select Clusters on the left. For the cluster to terminate, under Actions, point to the ellipsis (…) and select the Terminate icon.Reference:
https://docs.microsoft.com/en-us/azure/azure-databricks/databricks-extract-load-sql-data-warehouse -
HOTSPOT
You build an Azure Data Factory pipeline to move data from an Azure Data Lake Storage Gen2 container to a database in an Azure Synapse Analytics dedicated SQL pool.
Data in the container is stored in the following folder structure.
/in/{YYYY}/{MM}/{DD}/{HH}/{mm}The earliest folder is /in/2021/01/01/00/00. The latest folder is /in/2021/01/15/01/45.
You need to configure a pipeline trigger to meet the following requirements:
– Existing data must be loaded.
– Data must be loaded every 30 minutes.
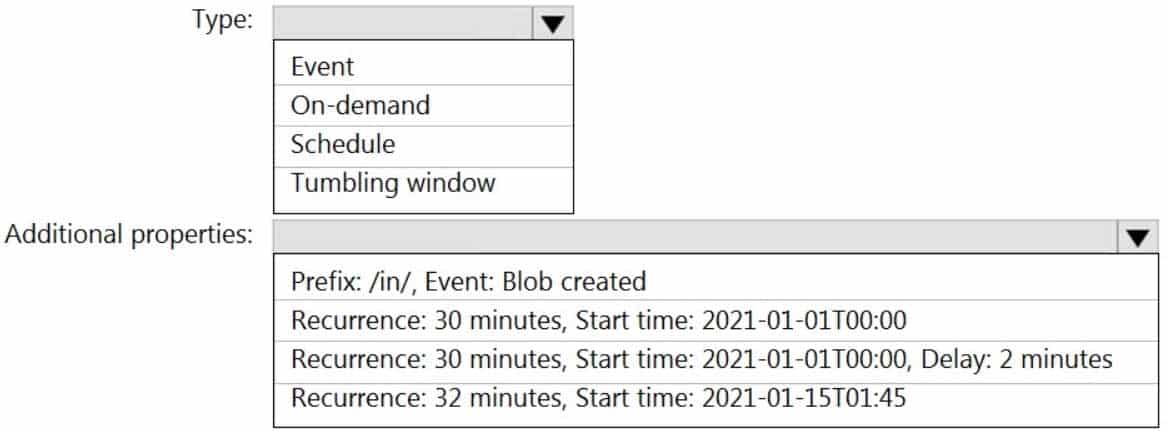
– Late-arriving data of up to two minutes must he included in the load for the time at which the data should have arrived.How should you configure the pipeline trigger? To answer, select the appropriate options in the answer area.
NOTE: Each correct selection is worth one point.
DP-203 Data Engineering on Microsoft Azure Part 02 Q13 037 Question 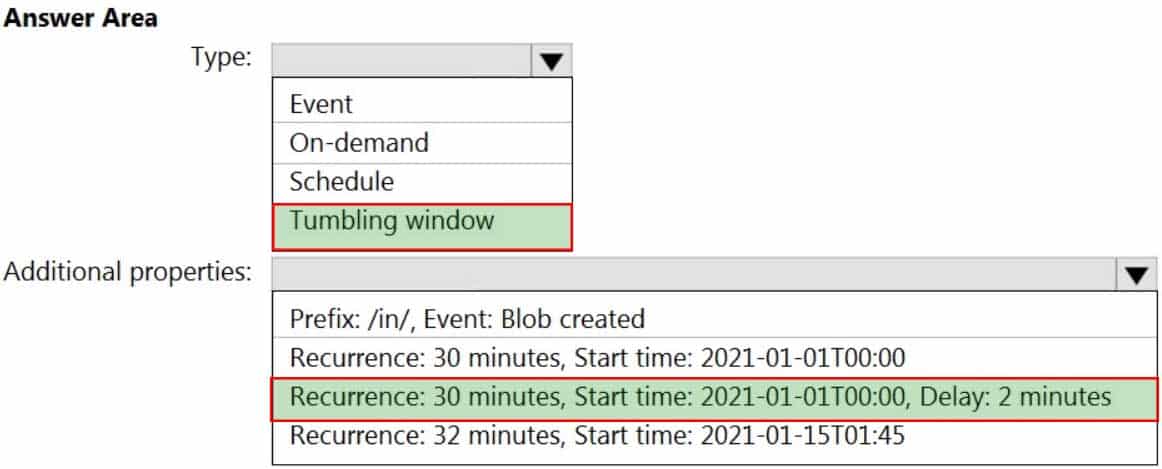
DP-203 Data Engineering on Microsoft Azure Part 02 Q13 037 Answer Explanation:Box 1: Tumbling window
To be able to use the Delay parameter we select Tumbling window.
Box 2:
Recurrence: 30 minutes, not 32 minutes
Delay: 2 minutes.
The amount of time to delay the start of data processing for the window. The pipeline run is started after the expected execution time plus the amount of delay. The delay defines how long the trigger waits past the due time before triggering a new run. The delay doesn’t alter the window startTime. -
HOTSPOT
You are designing a real-time dashboard solution that will visualize streaming data from remote sensors that connect to the internet. The streaming data must be aggregated to show the average value of each 10-second interval. The data will be discarded after being displayed in the dashboard.
The solution will use Azure Stream Analytics and must meet the following requirements:
– Minimize latency from an Azure Event hub to the dashboard.
– Minimize the required storage.
– Minimize development effort.What should you include in the solution? To answer, select the appropriate options in the answer area.
NOTE: Each correct selection is worth one point
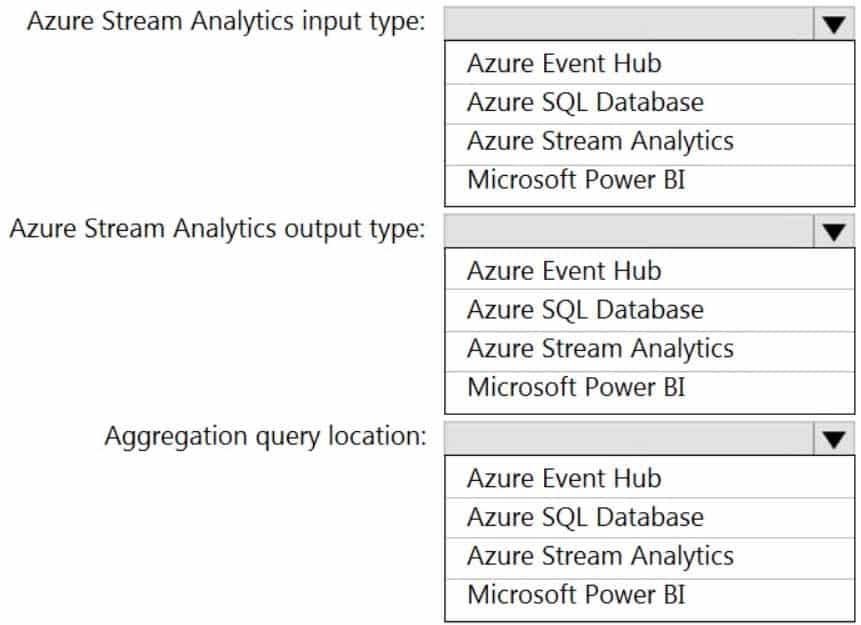
DP-203 Data Engineering on Microsoft Azure Part 02 Q14 038 Question 
DP-203 Data Engineering on Microsoft Azure Part 02 Q14 038 Answer -
DRAG DROP
You have an Azure Stream Analytics job that is a Stream Analytics project solution in Microsoft Visual Studio. The job accepts data generated by IoT devices in the JSON format.
You need to modify the job to accept data generated by the IoT devices in the Protobuf format.
Which three actions should you perform from Visual Studio on sequence? To answer, move the appropriate actions from the list of actions to the answer area and arrange them in the correct order.

DP-203 Data Engineering on Microsoft Azure Part 02 Q15 039 Question 
DP-203 Data Engineering on Microsoft Azure Part 02 Q15 039 Answer Explanation:Step 1: Add an Azure Stream Analytics Custom Deserializer Project (.NET) project to the solution.
Create a custom deserializer
1. Open Visual Studio and select File > New > Project. Search for Stream Analytics and select Azure Stream Analytics Custom Deserializer Project (.NET). Give the project a name, like Protobuf Deserializer.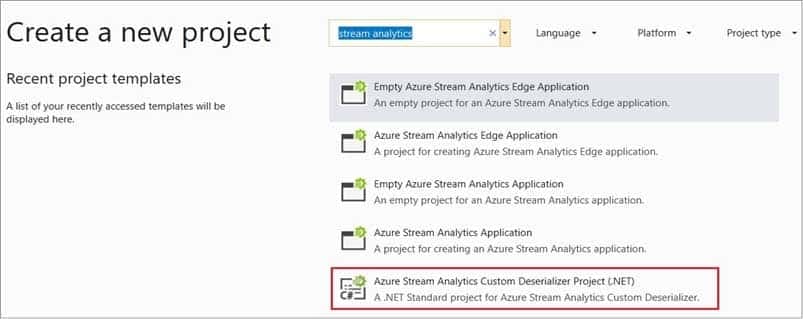
DP-203 Data Engineering on Microsoft Azure Part 02 Q15 040 2. In Solution Explorer, right-click your Protobuf Deserializer project and select Manage NuGet Packages from the menu. Then install the Microsoft.Azure.StreamAnalytics and Google.Protobuf NuGet packages.
3. Add the MessageBodyProto class and the MessageBodyDeserializer class to your project.
4. Build the Protobuf Deserializer project.Step 2: Add .NET deserializer code for Protobuf to the custom deserializer project
Azure Stream Analytics has built-in support for three data formats: JSON, CSV, and Avro. With custom .NET deserializers, you can read data from other formats such as Protocol Buffer, Bond and other user defined formats for both cloud and edge jobs.Step 3: Add an Azure Stream Analytics Application project to the solution
Add an Azure Stream Analytics project
1. In Solution Explorer, right-click the Protobuf Deserializer solution and select Add > New Project. Under Azure Stream Analytics > Stream Analytics, choose Azure Stream Analytics Application. Name it ProtobufCloudDeserializer and select OK.
2. Right-click References under the ProtobufCloudDeserializer Azure Stream Analytics project. Under Projects, add Protobuf Deserializer. It should be automatically populated for you. -
You have an Azure Storage account and a data warehouse in Azure Synapse Analytics in the UK South region.
You need to copy blob data from the storage account to the data warehouse by using Azure Data Factory. The solution must meet the following requirements:
– Ensure that the data remains in the UK South region at all times.
– Minimize administrative effort.Which type of integration runtime should you use?
- Azure integration runtime
- Azure-SSIS integration runtime
- Self-hosted integration runtime
-
HOTSPOT
You have an Azure SQL database named Database1 and two Azure event hubs named HubA and HubB. The data consumed from each source is shown in the following table.
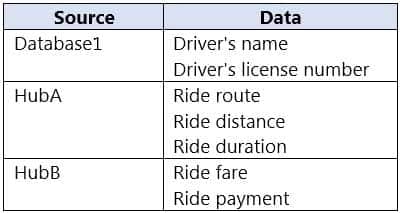
DP-203 Data Engineering on Microsoft Azure Part 02 Q17 042 You need to implement Azure Stream Analytics to calculate the average fare per mile by driver.
How should you configure the Stream Analytics input for each source? To answer, select the appropriate options in the answer area.
NOTE: Each correct selection is worth one point.

DP-203 Data Engineering on Microsoft Azure Part 02 Q17 043 Question 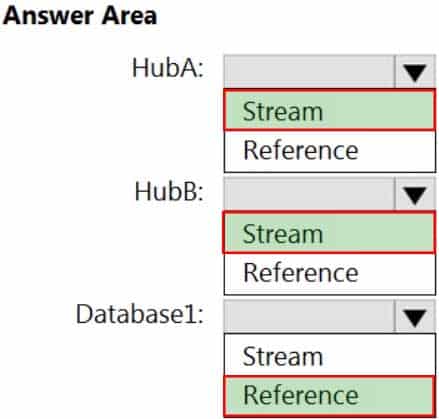
DP-203 Data Engineering on Microsoft Azure Part 02 Q17 043 Answer Explanation:Hub A: Stream
Hub B: Stream
Database1: Reference
Reference data (also known as a lookup table) is a finite data set that is static or slowly changing in nature, used to perform a lookup or to augment your data streams. For example, in an IoT scenario, you could store metadata about sensors (which don’t change often) in reference data and join it with real time IoT data streams. Azure Stream Analytics loads reference data in memory to achieve low latency stream processing -
You have an Azure Stream Analytics job that receives clickstream data from an Azure event hub.
You need to define a query in the Stream Analytics job. The query must meet the following requirements:
– Count the number of clicks within each 10-second window based on the country of a visitor.
– Ensure that each click is NOT counted more than once.How should you define the Query?
-
SELECT Country, Avg(*) AS Average

FROM ClickStream TIMESTAMP BY CreatedAt

GROUP BY Country, SlidingWindow(second, 10)
-
SELECT Country, Count(*) AS Count FROM ClickStream TIMESTAMP BY CreatedAt GROUP BY Country, TumblingWindow(second, 10) -
SELECT Country, Avg(*) AS Average

FROM ClickStream TIMESTAMP BY CreatedAt

GROUP BY Country, HoppingWindow(second, 10, 2)
-
SELECT Country, Count(*) AS Count

FROM ClickStream TIMESTAMP BY CreatedAt

GROUP BY Country, SessionWindow(second, 5, 10)
Explanation:Tumbling window functions are used to segment a data stream into distinct time segments and perform a function against them, such as the example below. The key differentiators of a Tumbling window are that they repeat, do not overlap, and an event cannot belong to more than one tumbling window.
Example:Incorrect Answers:
A: Sliding windows, unlike Tumbling or Hopping windows, output events only for points in time when the content of the window actually changes. In other words, when an event enters or exits the window. Every window has at least one event, like in the case of Hopping windows, events can belong to more than one sliding window.C: Hopping window functions hop forward in time by a fixed period. It may be easy to think of them as Tumbling windows that can overlap, so events can belong to more than one Hopping window result set. To make a Hopping window the same as a Tumbling window, specify the hop size to be the same as the window size.
D: Session windows group events that arrive at similar times, filtering out periods of time where there is no data.
-
-
HOTSPOT
You are building an Azure Analytics query that will receive input data from Azure IoT Hub and write the results to Azure Blob storage.
You need to calculate the difference in readings per sensor per hour.
How should you complete the query? To answer, select the appropriate options in the answer area.
NOTE: Each correct selection is worth one point.

DP-203 Data Engineering on Microsoft Azure Part 02 Q19 044 Question 
DP-203 Data Engineering on Microsoft Azure Part 02 Q19 044 Answer Explanation:Box 1: LAG
The LAG analytic operator allows one to look up a “previous” event in an event stream, within certain constraints. It is very useful for computing the rate of growth of a variable, detecting when a variable crosses a threshold, or when a condition starts or stops being true.Box 2: LIMIT DURATION
Example: Compute the rate of growth, per sensor:SELECT sensorId,
growth = reading –
LAG(reading) OVER (PARTITION BY sensorId LIMIT DURATION(hour, 1))
FROM input -
You need to schedule an Azure Data Factory pipeline to execute when a new file arrives in an Azure Data Lake Storage Gen2 container.
Which type of trigger should you use?
- on-demand
- tumbling window
- schedule
- event
Explanation:
Event-driven architecture (EDA) is a common data integration pattern that involves production, detection, consumption, and reaction to events. Data integration scenarios often require Data Factory customers to trigger pipelines based on events happening in storage account, such as the arrival or deletion of a file in Azure Blob Storage account.
