DP-300 : Administering Relational Databases on Microsoft Azure : Part 04
DP-300 : Administering Relational Databases on Microsoft Azure : Part 04
-
You have an Azure SQL database named sqldb1.
You need to minimize the amount of space by the data and log files of sqldb1.
What should you run?
-
DBCC SHRINKDATABASE -
sp_clean_db_free_space
-
sp_clean_db_file_free_space
-
DBCC SHRINKFILE
Explanation:
DBCC SHRINKDATABASE shrinks the size of the data and log files in the specified database.
Incorrect Answers:
D: To shrink one data or log file at a time for a specific database, execute the DBCC SHRINKFILE command. -
-
You have an Azure SQL Database server named sqlsrv1 that hosts 10 Azure SQL databases.
The databases perform slower than expected.
You need to identify whether the performance issue relates to the use of tempdb by Azure SQL databases in sqlsrv1.
What should you do?
- Run Query Store-based queries
- Review information provided by SQL Server Profiler-based traces
- Review information provided by Query Performance Insight
- Run dynamic management view-based queries
-
DRAG DROP
You are building an Azure virtual machine.
You allocate two 1-TiB, P30 premium storage disks to the virtual machine. Each disk provides 5,000 IOPS.
You plan to migrate an on-premises instance of Microsoft SQL Server to the virtual machine. The instance has a database that contains a 1.2-TiB data file. The database requires 10,000 IOPS.
You need to configure storage for the virtual machine to support the database.
Which three objects should you create in sequence? To answer, move the appropriate objects from the list of objects to the answer area and arrange them in the correct order.

DP-300 Administering Relational Databases on Microsoft Azure Part 04 Q03 051 Question 
DP-300 Administering Relational Databases on Microsoft Azure Part 04 Q03 051 Answer Explanation:Follow these same steps to create striped virtual disk:
– Create Log Storage Pool.
– Create Virtual Disk
– Create VolumeBox 1: a storage pool
Box 2: a virtual disk that uses stripe layout
Disk Striping: Use multiple disks and stripe them together to get a combined higher IOPS and Throughput limit. The combined limit per VM should be higher than the combined limits of attached premium disks.Box 3: a volume
-
You have an Azure SQL database named sqldb1.
You need to minimize the possibility of Query Store transitioning to a read-only state.
What should you do?
- Double the value of Data Flush interval
- Decrease by half the value of Data Flush Interval
- Double the value of Statistics Collection Interval
- Decrease by half the value of Statistics Collection interval
Explanation:The Max Size (MB) limit isn’t strictly enforced. Storage size is checked only when Query Store writes data to disk. This interval is set by the Data Flush Interval (Minutes) option. If Query Store has breached the maximum size limit between storage size checks, it transitions to read-only mode.
Incorrect Answers:
C: Statistics Collection Interval: Defines the level of granularity for the collected runtime statistic, expressed in minutes. The default is 60 minutes. Consider using a lower value if you require finer granularity or less time to detect and mitigate issues. Keep in mind that the value directly affects the size of Query Store data. -
You have SQL Server 2019 on an Azure virtual machine that runs Windows Server 2019. The virtual machine has 4 vCPUs and 28 GB of memory.
You scale up the virtual machine to 16 vCPUSs and 64 GB of memory.
You need to provide the lowest latency for tempdb.
What is the total number of data files that tempdb should contain?
- 2
- 4
- 8
- 64
Explanation:
The number of files depends on the number of (logical) processors on the machine. As a general rule, if the number of logical processors is less than or equal to eight, use the same number of data files as logical processors. If the number of logical processors is greater than eight, use eight data files and then if contention continues, increase the number of data files by multiples of 4 until the contention is reduced to acceptable levels or make changes to the workload/code. -
HOTSPOT
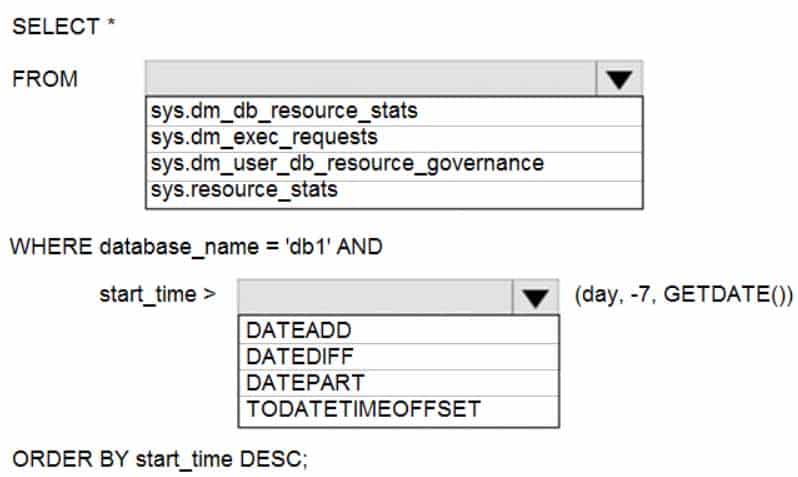
You have an Azure SQL database named db1.
You need to retrieve the resource usage of db1 from the last week.
How should you complete the statement? To answer, select the appropriate options in the answer area.
NOTE: Each correct selection is worth one point.
DP-300 Administering Relational Databases on Microsoft Azure Part 04 Q06 052 Question 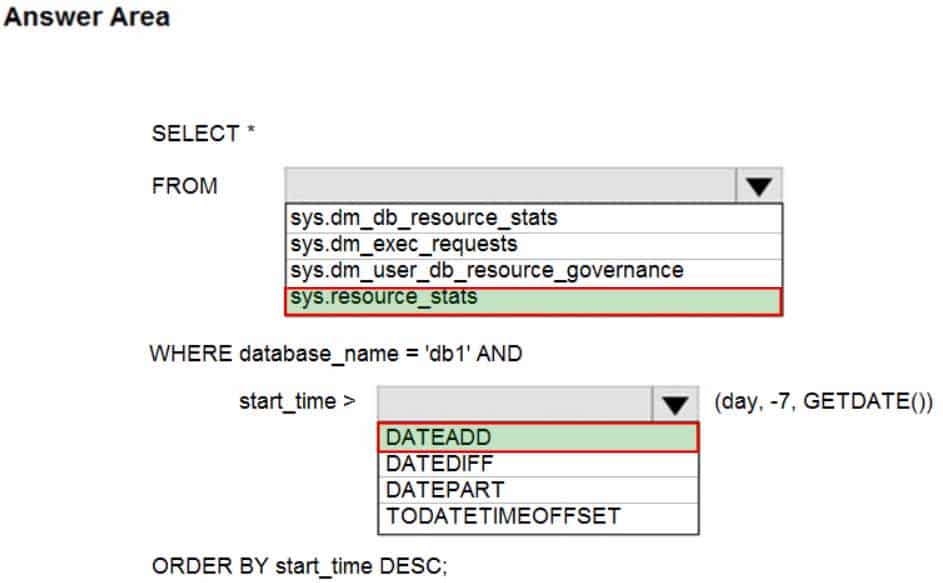
DP-300 Administering Relational Databases on Microsoft Azure Part 04 Q06 052 Answer Explanation:Box 1: sys.resource_stats
sys.resource_stats returns CPU usage and storage data for an Azure SQL Database. It has database_name and start_time columns.Box 2: DateAdd
The following example returns all databases that are averaging at least 80% of compute utilization over the last one week.DECLARE @s datetime;
DECLARE @e datetime;
SET @s= DateAdd(d,-7,GetUTCDate());
SET @e= GETUTCDATE();
SELECT database_name, AVG(avg_cpu_percent) AS Average_Compute_Utilization
FROM sys.resource_stats
WHERE start_time BETWEEN @s AND @e
GROUP BY database_name
HAVING AVG(avg_cpu_percent) >= 80Incorrect Answers:
sys.dm_exec_requests:
sys.dm_exec_requests returns information about each request that is executing in SQL Server. It does not have a column named database_name.sys.dm_db_resource_stats:
sys.dm_db_resource_stats does not have any start_time column.Note: sys.dm_db_resource_stats returns CPU, I/O, and memory consumption for an Azure SQL Database database. One row exists for every 15 seconds, even if there is no activity in the database. Historical data is maintained for approximately one hour.
Sys.dm_user_db_resource_governance returns actual configuration and capacity settings used by resource governance mechanisms in the current database or elastic pool. It does not have any start_time column.
-
You have 50 Azure SQL databases.
You need to notify the database owner when the database settings, such as the database size and pricing tier, are modified in Azure.
What should you do?
- Create a diagnostic setting for the activity log that has the Security log enabled.
- For the database, create a diagnostic setting that has the InstanceAndAppAdvanced metric enabled.
- Create an alert rule that uses a Metric signal type.
- Create an alert rule that uses an Activity Log signal type.
Explanation:Activity log events – An alert can trigger on every event, or, only when a certain number of events occur.
Incorrect Answers:
C: Metric values – The alert triggers when the value of a specified metric crosses a threshold you assign in either direction. That is, it triggers both when the condition is first met and then afterwards when that condition is no longer being met. -
You have several Azure SQL databases on the same Azure SQL Database server in a resource group named ResourceGroup1.
You must be alerted when CPU usage exceeds 80 percent for any database. The solution must apply to any additional databases that are created on the Azure SQL server.
Which resource type should you use to create the alert?
- Resource Groups
- SQL Servers
- SQL Databases
- SQL Virtual Machines
Explanation:There are resource types related to application code, compute infrastructure, networking, storage + databases.
You can deploy up to 800 instances of a resource type in each resource group.
Some resources can exist outside of a resource group. These resources are deployed to the subscription, management group, or tenant. Only specific resource types are supported at these scopes.
-
You have SQL Server 2019 on an Azure virtual machine that runs Windows Server 2019. The virtual machine has 4 vCPUs and 28 GB of memory.
You scale up the virtual machine to 8 vCPUSs and 64 GB of memory.
You need to provide the lowest latency for tempdb.
What is the total number of data files that tempdb should contain?
- 2
- 4
- 8
- 64
Explanation:
The number of files depends on the number of (logical) processors on the machine. As a general rule, if the number of logical processors is less than or equal to eight, use the same number of data files as logical processors. If the number of logical processors is greater than eight, use eight data files and then if contention continues, increase the number of data files by multiples of 4 until the contention is reduced to acceptable levels or make changes to the workload/code. -
You have SQL Server on an Azure virtual machine that contains a database named DB1. DB1 contains a table named CustomerPII.
You need to record whenever users query the CustomerPII table.
Which two options should you enable? Each correct answer presents part of the solution.
NOTE: Each correct selection is worth one point.
- server audit specification
- SQL Server audit
- database audit specification
- a server principal
Explanation:An auditing policy can be defined for a specific database or as a default server policy in Azure (which hosts SQL Database or Azure Synapse):
– A server policy applies to all existing and newly created databases on the server.
– If server auditing is enabled, it always applies to the database. The database will be audited, regardless of the database auditing settings.
– Enabling auditing on the database, in addition to enabling it on the server, does not override or change any of the settings of the server auditing. Both audits will exist side by side.Note:
The Server Audit Specification object belongs to an audit.
A Database Audit Specification defines which Audit Action Groups will be audited for the specific database in which the specification is created. -
You have an Azure virtual machine based on a custom image named VM1.
VM1 hosts an instance of Microsoft SQL Server 2019 Standard.
You need to automate the maintenance of VM1 to meet the following requirements:
– Automate the patching of SQL Server and Windows Server.
– Automate full database backups and transaction log backups of the databases on VM1.
– Minimize administrative effort.What should you do first?
- Enable a system-assigned managed identity for VM1
- Register the Azure subscription to the Microsoft.Sql resource provider
- Install an Azure virtual machine Desired State Configuration (DSC) extension on VM1
- Register the Azure subscription to the Microsoft.SqlVirtualMachine resource provider
Explanation:Automated Patching depends on the SQL Server infrastructure as a service (IaaS) Agent Extension. The SQL Server IaaS Agent Extension (SqlIaasExtension) runs on Azure virtual machines to automate administration tasks. The SQL Server IaaS extension is installed when you register your SQL Server VM with the SQL Server VM resource provider.
To utilize the SQL IaaS Agent extension, you must first register your subscription with the Microsoft.SqlVirtualMachine provider, which gives the SQL IaaS extension the ability to create resources within that specific subscription.
-
HOTSPOT
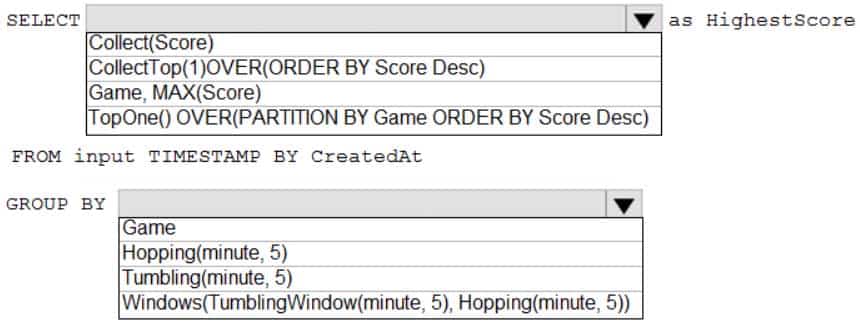
You are building an Azure Stream Analytics job to retrieve game data.
You need to ensure that the job returns the highest scoring record for each five-minute time interval of each game.
How should you complete the Stream Analytics query? To answer, select the appropriate options in the answer area.
NOTE: Each correct selection is worth one point.
DP-300 Administering Relational Databases on Microsoft Azure Part 04 Q12 053 Question 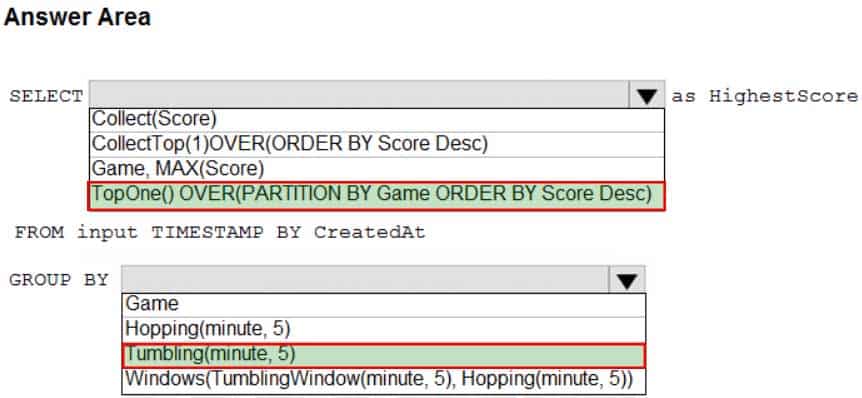
DP-300 Administering Relational Databases on Microsoft Azure Part 04 Q12 053 Answer Explanation:Box 1: TopOne() OVER(PARTITION BY Game ORDER BY Score Desc)
TopOne returns the top-rank record, where rank defines the ranking position of the event in the window according to the specified ordering. Ordering/ranking is based on event columns and can be specified in ORDER BY clause.Analytic Function Syntax:
TopOne() OVER ([<PARTITION BY clause>] ORDER BY (<column name> [ASC |DESC])+ <LIMIT DURATION clause> [<WHEN clause>])Box 2: Tumbling(minute 5)
Tumbling window functions are used to segment a data stream into distinct time segments and perform a function against them, such as the example below. The key differentiators of a Tumbling window are that they repeat, do not overlap, and an event cannot belong to more than one tumbling window.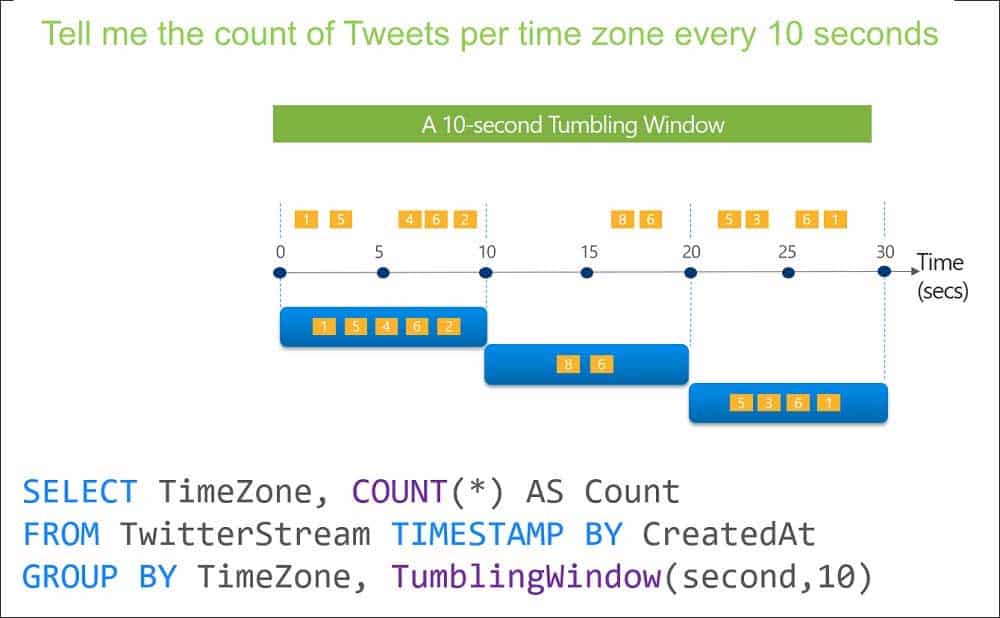
DP-300 Administering Relational Databases on Microsoft Azure Part 04 Q12 054 -
A company plans to use Apache Spark analytics to analyze intrusion detection data.
You need to recommend a solution to analyze network and system activity data for malicious activities and policy violations. The solution must minimize administrative efforts.
What should you recommend?
- Azure Data Lake Storage
- Azure Databricks
- Azure HDInsight
- Azure Data Factory
Explanation:Azure HDInsight offers pre-made, monitoring dashboards in the form of solutions that can be used to monitor the workloads running on your clusters. There are solutions for Apache Spark, Hadoop, Apache Kafka, live long and process (LLAP), Apache HBase, and Apache Storm available in the Azure Marketplace.
Note: With Azure HDInsight you can set up Azure Monitor alerts that will trigger when the value of a metric or the results of a query meet certain conditions. You can condition on a query returning a record with a value that is greater than or less than a certain threshold, or even on the number of results returned by a query. For example, you could create an alert to send an email if a Spark job fails or if a Kafka disk usage becomes over 90 percent full.
-
DRAG DROP
Your company analyzes images from security cameras and sends alerts to security teams that respond to unusual activity. The solution uses Azure Databricks.
You need to send Apache Spark level events, Spark Structured Streaming metrics, and application metrics to Azure Monitor.
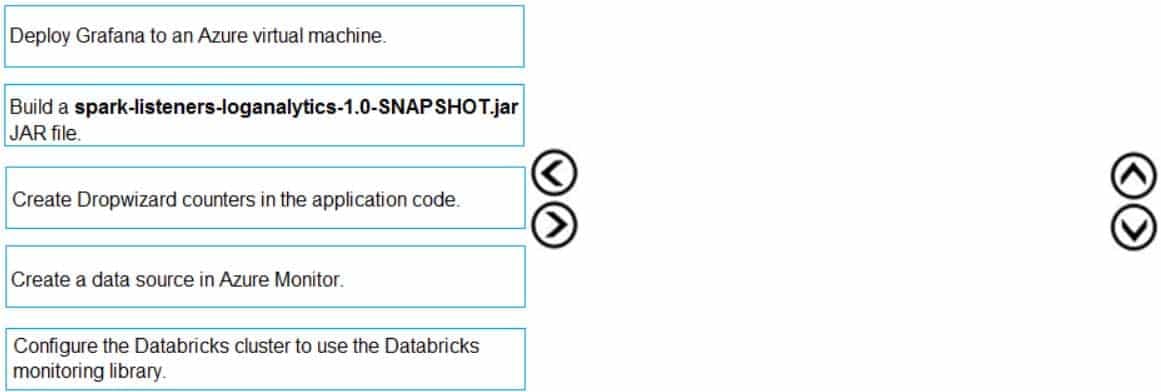
Which three actions should you perform in sequence? To answer, move the appropriate actions from the list of actions in the answer area and arrange them in the correct order.
DP-300 Administering Relational Databases on Microsoft Azure Part 04 Q14 055 Question 
DP-300 Administering Relational Databases on Microsoft Azure Part 04 Q14 055 Answer Explanation:Send application metrics using Dropwizard.
Spark uses a configurable metrics system based on the Dropwizard Metrics Library.To send application metrics from Azure Databricks application code to Azure Monitor, follow these steps:
Step 1: Configure your Azure Databricks cluster to use the Databricksmonitoring library.
Prerequisite: Configure your Azure Databricks cluster to use the monitoring library.Step 2: Build the spark-listeners-loganalytics-1.0-SNAPSHOT.jar JAR file
Step 3: Create Dropwizard counters in your application code
Create Dropwizard gauges or counters in your application code -
You have an Azure data solution that contains an enterprise data warehouse in Azure Synapse Analytics named DW1.
Several users execute adhoc queries to DW1 concurrently.
You regularly perform automated data loads to DW1.
You need to ensure that the automated data loads have enough memory available to complete quickly and successfully when the adhoc queries run.
What should you do?
- Assign a smaller resource class to the automated data load queries.
- Create sampled statistics to every column in each table of DW1.
- Assign a larger resource class to the automated data load queries.
- Hash distribute the large fact tables in DW1 before performing the automated data loads.
Explanation:
The performance capacity of a query is determined by the user’s resource class.
Smaller resource classes reduce the maximum memory per query, but increase concurrency.
Larger resource classes increase the maximum memory per query, but reduce concurrency. -
You are monitoring an Azure Stream Analytics job.
You discover that the Backlogged input Events metric is increasing slowly and is consistently non-zero.
You need to ensure that the job can handle all the events.
What should you do?
- Remove any named consumer groups from the connection and use $default.
- Change the compatibility level of the Stream Analytics job.
- Create an additional output stream for the existing input stream.
- Increase the number of streaming units (SUs).
Explanation:
Backlogged Input Events: Number of input events that are backlogged. A non-zero value for this metric implies that your job isn’t able to keep up with the number of incoming events. If this value is slowly increasing or consistently non-zero, you should scale out your job, by increasing the SUs. -
You have an Azure Stream Analytics job.
You need to ensure that the job has enough streaming units provisioned.
You configure monitoring of the SU % Utilization metric.
Which two additional metrics should you monitor? Each correct answer presents part of the solution.
NOTE: Each correct selection is worth one point.
- Late Input Events
- Out of order Events
- Backlogged Input Events
- Watermark Delay
- Function Events
Explanation:To react to increased workloads and increase streaming units, consider setting an alert of 80% on the SU Utilization metric. Also, you can use watermark delay and backlogged events metrics to see if there is an impact.
Note: Backlogged Input Events: Number of input events that are backlogged. A non-zero value for this metric implies that your job isn’t able to keep up with the number of incoming events. If this value is slowly increasing or consistently non-zero, you should scale out your job, by increasing the SUs.
-
You have an Azure Databricks resource.
You need to log actions that relate to changes in compute for the Databricks resource.
Which Databricks services should you log?
- clusters
- jobs
- DBFS
- SSH
- workspace
Explanation:Cloud Provider Infrastructure Logs.
Databricks logging allows security and admin teams to demonstrate conformance to data governance standards within or from a Databricks workspace. Customers, especially in the regulated industries, also need records on activities like:
– User access control to cloud data storage
– Cloud Identity and Access Management roles
– User access to cloud network and computeAzure Databricks offers three distinct workloads on several VM Instances tailored for your data analytics workflow—the Jobs Compute and Jobs Light Compute workloads make it easy for data engineers to build and execute jobs, and the All-Purpose Compute workload makes it easy for data scientists to explore, visualize, manipulate, and share data and insights interactively.
-
Your company uses Azure Stream Analytics to monitor devices.
The company plans to double the number of devices that are monitored.
You need to monitor a Stream Analytics job to ensure that there are enough processing resources to handle the additional load.
Which metric should you monitor?
- Input Deserialization Errors
- Late Input Events
- Early Input Events
- Watermark delay
Explanation:The Watermark delay metric is computed as the wall clock time of the processing node minus the largest watermark it has seen so far.
The watermark delay metric can rise due to:
1. Not enough processing resources in Stream Analytics to handle the volume of input events.
2. Not enough throughput within the input event brokers, so they are throttled.
3. Output sinks are not provisioned with enough capacity, so they are throttled. -
You manage an enterprise data warehouse in Azure Synapse Analytics.
Users report slow performance when they run commonly used queries. Users do not report performance changes for infrequently used queries.
You need to monitor resource utilization to determine the source of the performance issues.
Which metric should you monitor?
- Local tempdb percentage
- DWU percentage
- Data Warehouse Units (DWU) used
- Cache hit percentage
Explanation:Tempdb is used to hold intermediate results during query execution. High utilization of the tempdb database can lead to slow query performance.
Note: If you have a query that is consuming a large amount of memory or have received an error message related to allocation of tempdb, it could be due to a very large CREATE TABLE AS SELECT (CTAS) or INSERT SELECT statement running that is failing in the final data movement operation.