9.2.6 Lab – Using Wireshark to Observe the TCP 3-Way Handshake Answers
Lab – Using Wireshark to Observe the TCP 3-Way Handshake (Answers Version)
Answers Note: Red font color or gray highlights indicate text that appears in the instructor copy only.
Mininet Topology

Objectives
Part 1: Prepare the Hosts to Capture the Traffic
Part 2: Analyze the Packets using Wireshark
Part 3: View the Packets using tcpdump
Background / Scenario
In this lab, you will use Wireshark to capture and examine packets generated between the PC browser using the HyperText Transfer Protocol (HTTP) and a web server, such as www.google.com. When an application, such as HTTP or File Transfer Protocol (FTP) first starts on a host, TCP uses the three-way handshake to establish a reliable TCP session between the two hosts. For example, when a PC uses a web browser to surf the internet, a three-way handshake is initiated, and a session is established between the PC host and web server. A PC can have multiple, simultaneous, active TCP sessions with various web sites.
Answers Note: Using a packet sniffer, such as Wireshark, may be considered a breach of the security policy of the school. It is recommended that permission be obtained before running Wireshark for this lab. If using a packet sniffer is an issue, the instructor may wish to assign the lab as homework or perform a walk-through demonstration.
Required Resources
Instructions
Part 1: Prepare the Hosts to Capture the Traffic
- Start the CyberOps VM. Log in with username analyst and the password cyberops.
- Start Mininet.
[analyst@secOps ~]$ sudo lab.support.files/scripts/cyberops_topo.py
- Start host H1 and H4 in Mininet.
*** Starting CLI:
mininet> xterm H1
mininet> xterm H4
- Start the web server on H4.
[root@secOps analyst]# /home/analyst/lab.support.files/scripts/reg_server_start.sh
- For security purposes, you are not able to run Firefox from the root user account. On host H1, use the switch user command to switch from the root user to the analyst user account:
[root@secOps analyst]# su analyst
- Start the web browser on H1. This will take a few moments.
[analyst@secOps ~]$ firefox &
- After the Firefox window opens, start a tcpdump session in the terminal Node: H1 and send the output to a file called capture.pcap. With the -v option, you can watch the progress. This capture will stop after capturing 50 packets, as it is configured with the option -c 50.
[analyst@secOps ~]$ sudo tcpdump –i H1-eth0 -v -c 50 -w /home/analyst/capture.pcap
- After the tcpdump starts, quickly navigate to 172.16.0.40 in the Firefox web browser.
Part 2: Analyze the Packets using Wireshark
Step 1: Apply a filter to the saved capture.
- Press ENTER to see the prompt. Start Wireshark on Node: H1. Click OK when prompted by the warning regarding running Wireshark as superuser.
[analyst@secOps ~]$ wireshark &
- In Wireshark, click File > Open. Select the saved pcap file located at /home/analyst/capture.pcap.
- Apply a tcp filter to the capture. In this example, the first 3 frames are the interested traffic.

Step 2: Examine the information within packets including IP addresses, TCP port numbers, and TCP control flags.
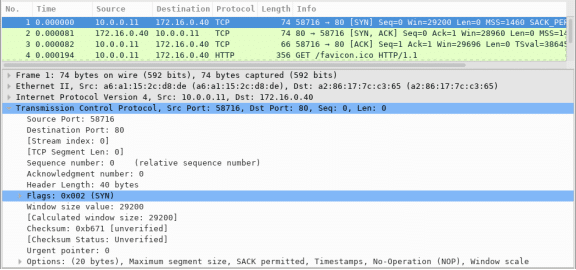
- In this example, frame 1 is the start of the three-way handshake between the PC and the server on H4. In the packet list pane (top section of the main window), select the first packet, if necessary.
- Click the arrow to the left of the Transmission Control Protocol in the packet details pane to expand it and examine the TCP information. Locate the source and destination port information.
- Click the arrow to the left of the Flags. A value of 1 means that flag is set. Locate the flag that is set in this packet.
Note: You may have to adjust the top and middle windows sizes within Wireshark to display the necessary information.

Questions:
What is the TCP source port number?
Type your answers here.
Answers will vary. In this example, the source port is 58716.
How would you classify the source port?
Type your answers here.
Dynamic or Private
What is the TCP destination port number?
Type your answers here.
Port 80
How would you classify the destination port?
Type your answers here.
Well-known, registered (HTTP or web protocol)
Which flag (or flags) is set?
Type your answers here.
SYN flag
What is the relative sequence number set to?
Type your answers here.
0
- Select the next packet in the three-way handshake. In this example, this is frame 2. This is the web server replying to the initial request to start a session.

Questions:
What are the values of the source and destination ports?
Type your answers here.
Source Port is now 80, and Destination Port is now 58716
Which flags are set?
Type your answers here.
The Acknowledgment flag (ACK) and Syn flag (SYN)
What are the relative sequence and acknowledgment numbers set to?
Type your answers here.
The relative sequence number is 0, and the relative acknowledgment number is 1.
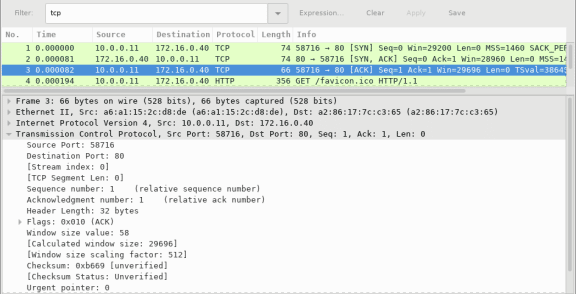
- Finally, select the third packet in the three-way handshake.

Examine the third and final packet of the handshake.
Question:
Which flag (or flags) is set?
Type your answers here.
Acknowledgment flag (ACK)
The relative sequence and acknowledgment numbers are set to 1 as a starting point. The TCP connection is established and communication between the source computer and the web server can begin.
Part 3: View the packets using tcpdump
You can also view the pcap file and filter for the desired information.
- Open a new terminal window, enter man tcpdump. Note: You may need to press ENTER to see the prompt.
Using the manual pages available with the Linux operating system, you read or search through the manual pages for options for selecting the desired information from the pcap file.
[analyst@secOps ~]$ man tcpdump
TCPDUMP(1) General Commands Manual TCPDUMP(1)
NAME
tcpdump – dump traffic on a network
SYNOPSIS
tcpdump [ –AbdDefhHIJKlLnNOpqStuUvxX# ] [ -B buffer_size ]
[ -c count ]
[ -C file_size ] [ -G rotate_seconds ] [ -F file ]
[ –i interface ] [ -j tstamp_type ] [ -m module ] [ -M secret ]
[ —number ] [ -Q in|out|inout ]
[ -r file ] [ -V file ] [ -s snaplen ] [ -T type ] [ -w file ]
[ -W filecount ]
[ -E spi@ipaddr algo:secret,… ]
[ -y datalinktype ] [ -z postrotate-command ] [ -Z user ]
[ –time-stamp-precision=tstamp_precision ]
[ –immediate-mode ] [ –version ]
[ expression ]
<some output omitted>
To search through the man pages, you can use / (searching forward) or ? (searching backward) to find specific terms, and n to forward to the next match and q to quit. For example, search for the information on the switch -r, type /-r. Type n to move to the next match.
Question:
What does the switch -r do?
Type your answers here.
The option -r allows you to read packet from file that was saved using -w option with tcpdump or other tools that write pcap or pcap-ng files, such as Wireshark.
- In the same terminal, open the capture file using the following command to view the first 3 TCP packets captured:
[analyst@secOps ~]$ tcpdump -r /home/analyst/capture.pcap tcp -c 3
reading from file capture.pcap, link-type EN10MB (Ethernet)
13:58:30.647462 IP 10.0.0.11.58716 > 172.16.0.40.http: Flags [S], seq 2432755549, win 29200, options [mss 1460,sackOK,TS val 3864513189 ecr 0,nop,wscale 9], length 0
13:58:30.647543 IP 172.16.0.40.http > 10.0.0.11.58716: Flags [S.], seq 1766419191, ack 2432755550, win 28960, options [mss 1460,sackOK,TS val 50557410 ecr 3864513189,nop,wscale 9], length 0
13:58:30.647544 IP 10.0.0.11.58716 > 172.16.0.40.http: Flags [.], ack 1, win 58, options [nop,nop,TS val 3864513189 ecr 50557410], length 0
To view the 3-way handshake, you may need to increase the number of lines after the -c option.
- Navigate to the terminal used to start Mininet. Terminate the Mininet by entering quit in the main CyberOps VM terminal window.
mininet> quit
*** Stopping 0 controllers
*** Stopping 2 terms
*** Stopping 5 links
…..
*** Stopping 1 switches
s1
*** Stopping 5 hosts
H1 H2 H3 H4 R1
*** Done
[analyst@secOps ~]$
- After quitting Mininet, enter sudo mn -c to clean up the processes started by Mininet. Enter the password cyberops when prompted.
[analyst@secOps ~]$ sudo mn -c
[sudo] password for analyst:
Reflection Questions
- There are hundreds of filters available in Wireshark. A large network could have numerous filters and many different types of traffic. List three filters that might be useful to a network administrator.
Type your answers here.
Answers will vary but could include TCP, specific IP Addresses (source and/or destination), and protocols such as HTTP.
- What other ways could Wireshark be used in a production network?
Type your answers here.
Wireshark is often used for security purposes for after-the-fact analysis of normal traffic or after a network attack. New protocols or services may need to be captured to determine what port or ports are used.