Data Analytics Essentials Course Final Exam Answers Full 100% 2023 2024
-
A data analyst uses Excel and Tableau to identify patterns and correlations in a dataset to draw conclusions. Which phase of the analytic process is the analyst currently working on?
- analyzing the data
- presenting the results
- preparing the data
- investigating the data
Explanation & Hint: During the analyzing data phase of an analytic project, an analyst looks for patterns and correlations in the data set to draw conclusions.
-
Which statement is true concerning data analytics?
- Predictive analytics uses simulation models and forecasting to suggest what could happen.
- Descriptive analytics attempts to predict what will happen next.
- Descriptive analytics uses a feedback system to track the outcome of actions taken.
- Prescriptive analytics uses historical data to provide regular reports on events that have already happened.
Explanation & Hint: Descriptive analytics uses historical data to provide regular reports on events that have already happened. Prescriptive analytics uses a feedback system to track the outcome of actions taken. Predictive analytics uses data and statistical techniques to predict future trends. All three types of analytics (Prescriptive, Predictive, and Descriptive) are used in Big Data analysis.
-
Match the task and purpose to the appropriate Big Data analytics method.
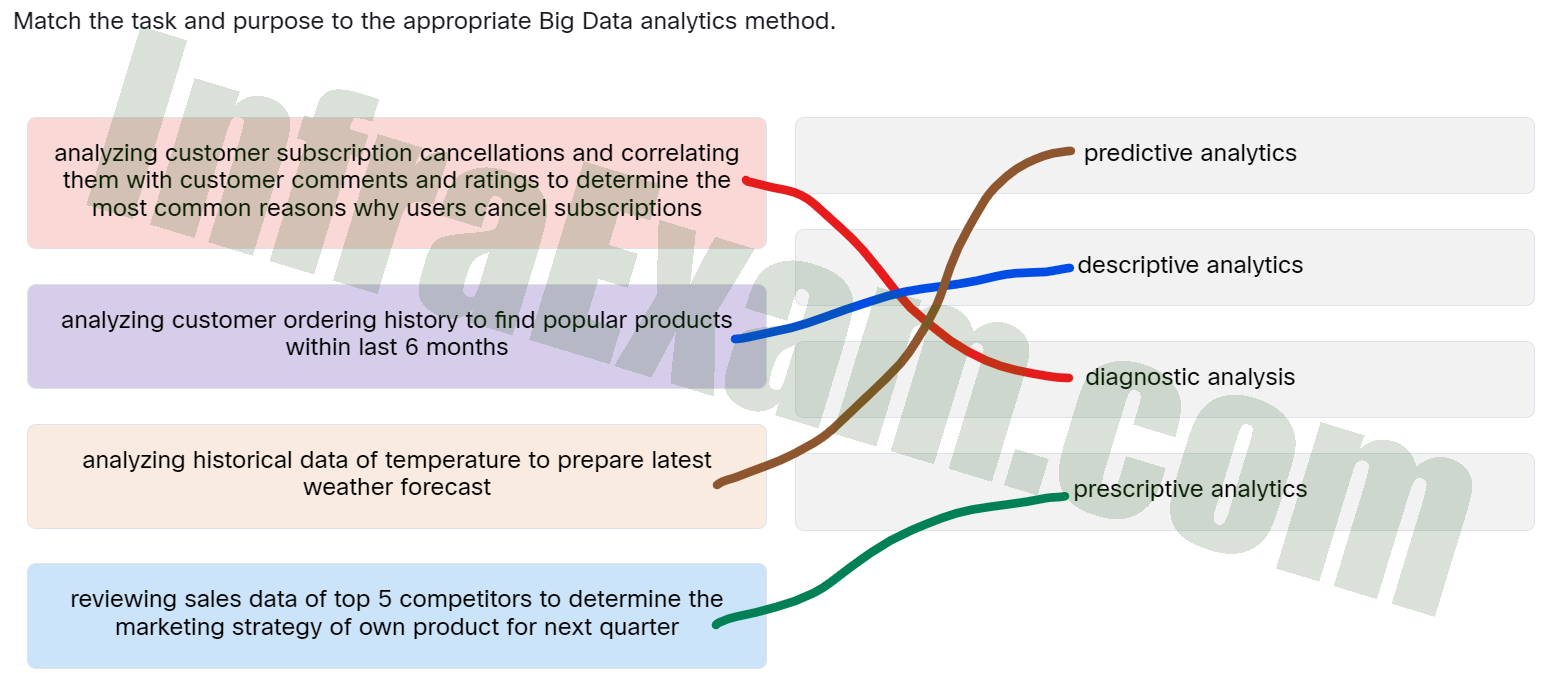
Match the task and purpose to the appropriate Big Data analytics method - analyzing customer subscription cancellations and correlating them with customer comments and ratings to determine the most common reasons why users cancel subscriptions ==> Diagnostic analysis
- analyzing customer ordering history to find popular products within last 6 months ==> Descriptive analytics
- analyzing historical data of temperature to prepare latest weather forecast ==> Predictive analytics
- reviewing sales data of top 5 competitors to determine the marketing strategy of own product for next quarter ==> Prescriptive analytics
Explanation & Hint: Place the options in the following order:
Analyzing customer subscription cancellations and correlating them with customer comments and ratings to determine the most common reasons why users cancel subscriptions Diagnostic analysis Analyzing customer ordering history to find popular products within last 6 months Descriptive analytics Analyzing historical data of temperature to prepare latest weather forecast Predictive analytics Reviewing sales data of top 5 competitors to determine the marketing strategy of own product for next quarter Prescriptive analytics
-
Match the type of data analysis with the question it can answer.
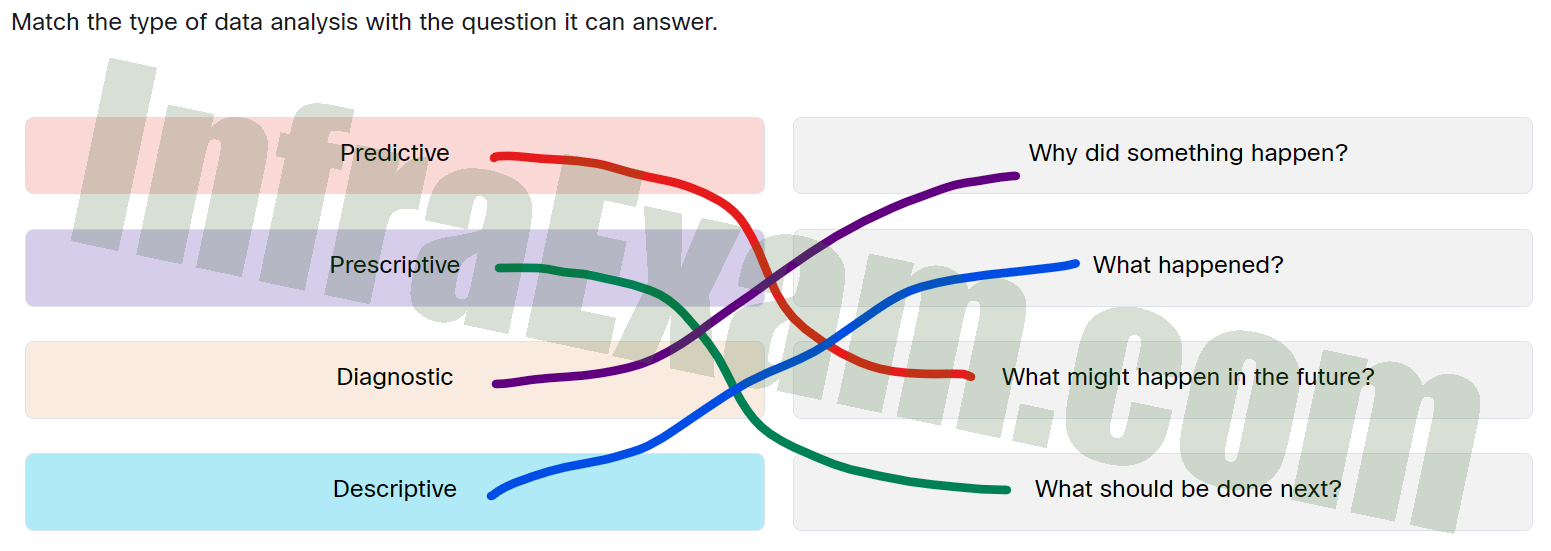
Match the type of data analysis with the question it can answer - Predictive ==> What might happen in the future?
- Prescriptive ==> What should be done next?
- Diagnostic ==> Why did something happen?
- Descriptive ==> What happened?
Explanation & Hint: Place the options in the following order:
Predictive What might happen in the future? Prescriptive What should be done next? Diagnostic Why did something happen? Descriptive What happened?
-
Refer to the exhibit. A data analyst wants to create a formula in Microsoft Excel that will automatically calculate the net revenue from the sales of dining sets. Which formula inserted in cell F2 will accomplish this?
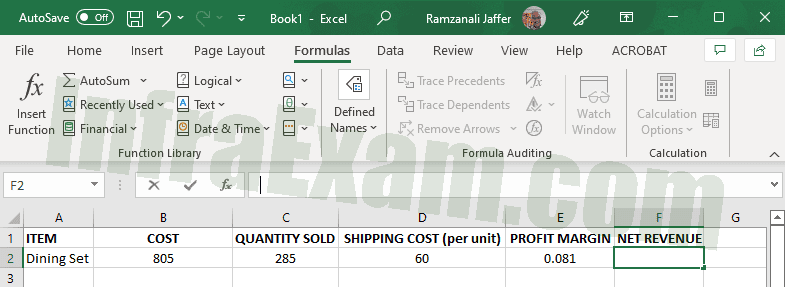
Data Analytics Essentials Course Final Exam Answers 05 - =(C2*(B2-D2)*E2)
- =(B2*C2)-(D2*C2)*E2
- =B2*C2-D2*E2
- =B2-D2+C2*E2
Explanation & Hint: The correct formula is =(C2*(B2-D2)*E2) and will yield a net loss in revenue amounting to $580.10.
-
Which type of variable is used for qualitative values such as gender or eye color?
- continuous
- nominal
- discrete
- ordinal
Explanation & Hint: Variables are either categorical or numerical. Categorical variables are qualitative and are either nominal or ordinal. Nominal variables are used for values that are based on the identity of the object such as eye color or gender.
-
Match the variable with the description.
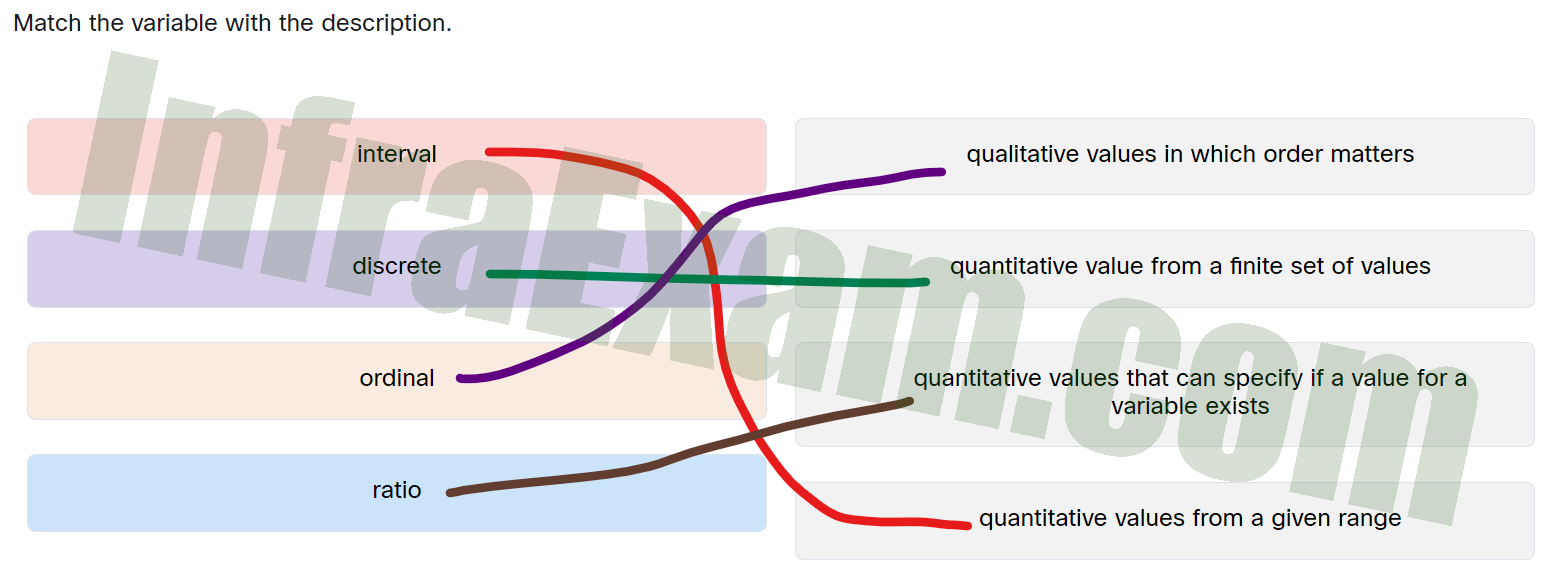
Match the variable with the description - interval ==> Quantitative values from a given range
- discrete ==> Quantitative value from a finite set of values
- ordinal ==> Qualitative values in which order matters
- ratio ==> Quantitative values that can specify if a value for a variable exists
Explanation & Hint: Place the options in the following order:
Interval Quantitative values from a given range Discrete Quantitative value from a finite set of values Ordinal Qualitative values in which order matters Ratio Quantitative values that can specify if a value for a variable exists
-
Refer to the exhibit. What is the resulting output from the formula in cell D8?
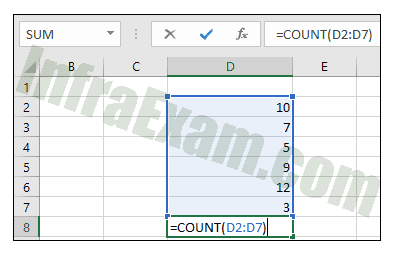
Data Analytics Essentials Course Final Exam Answers 03 - 6
- 46
- 12
- 7.6
Explanation & Hint: The COUNT function counts the number of cells containing numeric data in the formula range. In this example, the number of cells in the range D2 through D7 that contains data is 6.
-
Which two tasks are performed as part of the transform step of the ETL data process? (Choose two.)
- transferring the data into a database
- collecting and recording the data
- removing the blank records
- standardizing formats such as date, time, and location
- communicating results to decision-makers
Explanation & Hint: The process of transforming the data includes tasks such as:
- Combining and sorting data sources
- Locating and removing duplicate data
- Providing data for missing values
- Rejecting or correcting erroneous data
-
Match the ETL process with its description.
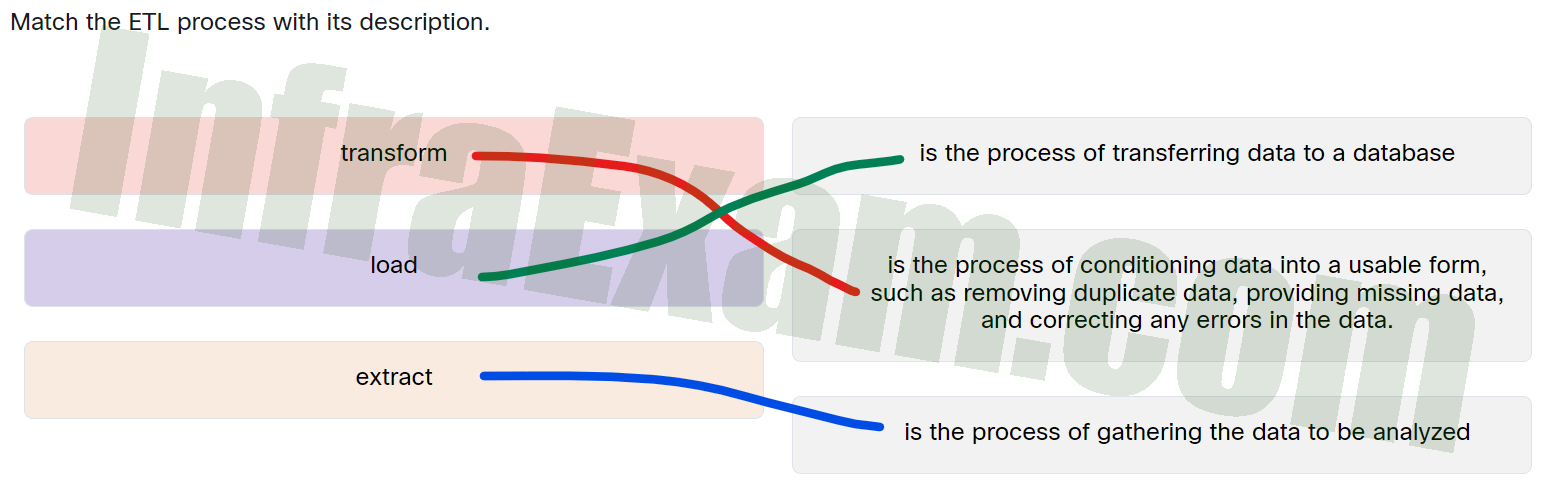
Match the ETL process with its description - transform ==> Is the process of conditioning data into a usable form, such as removing duplicate data, providing missing data, and correcting any errors in the data.
- load ==> Is the process of transferring data to a database
- extract ==> Is the process of gathering the data to be analyzed
Explanation & Hint: Place the options in the following order:
Transform Is the process of conditioning data into a usable form, such as removing duplicate data, providing missing data, and correcting any errors in the data. Load Is the process of transferring data to a database Extract Is the process of gathering the data to be analyzed
-
Which statement is true about the ELT and ETL process?
- In the ETL process, the extract step occurs after the load step.
- In the ETL process, the load step occurs before the transform step.
- In the ELT process, the transform step occurs on the stored data as it is used.
- In the ELT process, the load step occurs after the transform step.
Explanation & Hint: In the ETL process (Extract, Transform and Load), data is first extracted, then transformed and then loaded into the database. In the ELT process ((Extract, Load and Transform) the load and transform steps are reversed. ELT enables raw data to skip the transformation step and go straight to storage in an unstructured form. Transformation then occurs on the stored data as it is used.
-
What are two plain-text file types that are compatible with numerous applications and use a standard method of representing data records? (Choose two.)
- DOC
- XML
- XLS
- JSON
Explanation & Hint: As data is collected from varying sources and in varying formats, it is beneficial to utilize specific file types that allow easy conversion and universal application support. CSV, JSON, and XML are plain text file types that allow for collecting and analyzing of data in a format that is easily compatible and applicable for analysis.
-
A data analyst needs to organize sales data for analysis. Which Excel function can order the data by date sold, with the most recent sales listed first?
- Sort & Filter
- Conditional Formatting
- Text to Columns
- Find & Select
Explanation & Hint: The Sort & Filter tool in Excel allows an analyst to sort the contents of a column in either ascending order so that dates are earliest to most recent or descending order so that dates are most recent to earliest.
-
Match the Microsoft Excel function with its description.
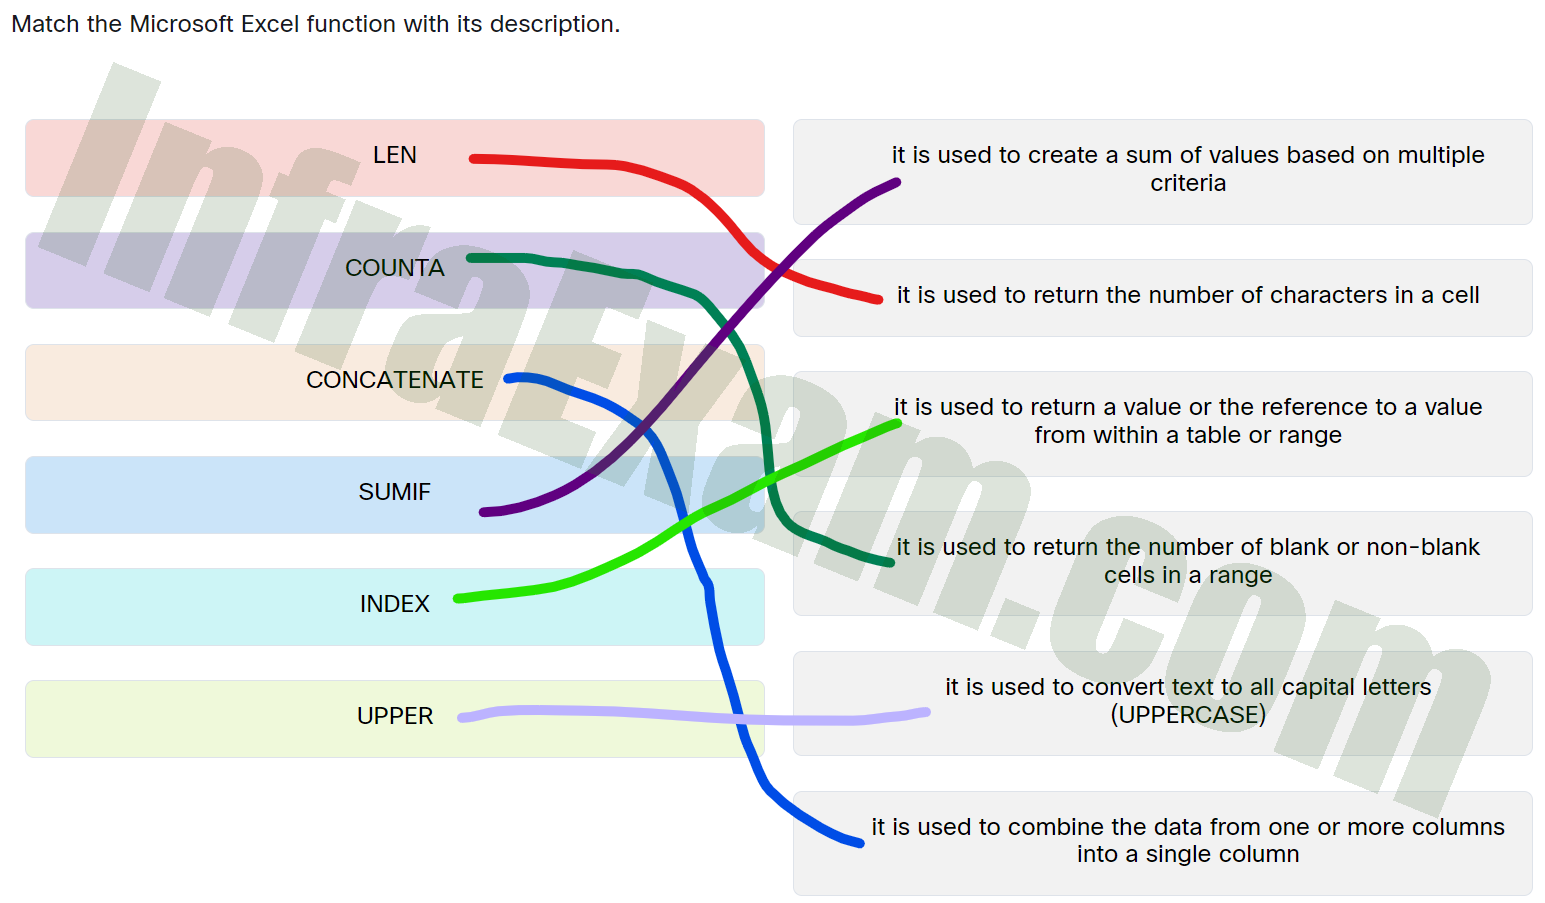
Match the Microsoft Excel function with its description - LEN ==> It is used to return the number of characters in a cell
- COUNTA ==> It is used to return the number of blank or non-blank cells in a range
- CONCATENATE ==> It is used to combine the data from one or more columns into a single column
- SUMIF ==> It is used to create a sum of values based on multiple criteria
- INDEX ==> It is used to return a value or the reference to a value from within a table or range
- UPPER ==> It is used to convert text to all capital letters (UPPERCASE)
Explanation & Hint: Place the options in the following order:
LEN It is used to return the number of characters in a cell COUNTA It is used to return the number of blank or non-blank cells in a range CONCATENATE It is used to combine the data from one or more columns into a single column SUMIF It is used to create a sum of values based on multiple criteria INDEX It is used to return a value or the reference to a value from within a table or range UPPER It is used to convert text to all capital letters (UPPERCASE)
-
What is a pivot table in Microsoft Excel?
- a function to investigate formula errors and correct them
- a table containing data that is organized vertically
- a table containing data that is organized horizontally
- a function to automatically summarize, analyze, explore, and present data
Explanation & Hint: Pivot tables provide a way to automatically summarize, analyze, explore, and present data. Using the built-in tools you can identify trends, make comparisons between data items and create charts in different styles to visualize your data. Pivoting data can help you answer different questions and even experiment with your data to discover new trends and patterns.
-
Which option in Microsoft Excel represents a formula with an absolute reference?
- =(B$1-B$3)
- =($A1-$B1)
- =(B$=(C$1$-F$1$)
- =($A$1-$B$1))
Explanation & Hint: Dollar symbols in a cell reference indicate to Microsoft Excel to treat the cell reference as absolute and to always refer to the value of the cell regardless of whether it is moved or where the formula is located. An absolute reference is designated in a formula by the addition of a dollar sign ($) before the column and row. As an absolute reference was used to refer to Cell B1, the formula will automatically update to wherever the contents of this cell is moved.
-
A data analyst wants to compare the average life expectancy and GDP for forty countries. Which type of visual representation would best suit this task?
- bar chart
- line graph
- scatter plots
- pie chart
Explanation & Hint: A scatter plot is a type of data visualization that shows the relationship between different variables. This data is shown by placing various data points between an x- and y-axis. Scatter plots are very popular for correlation visualizations, or when you want to show the distribution of a large number of data points. Scatter plots are also useful for demonstrating clustering or identifying outliers in the data.
-
What is a statistical analysis result that a descriptive statistical analysis will not provide?
- calculation of how widely dispersed the data is
- visualization of particular data trends occurring
- predictions made about other data sets that are not in the population
- calculation of the smallest or largest value
Explanation & Hint: Descriptive statistics are used to describe or summarize data in ways that are meaningful and useful. They describe the current or historical state of the observed population but do not allow for comparison of groups, conclusions to be drawn, or predictions to be made about other data sets that are not in the population.
-
A learner is analyzing a large volume of data in a Microsoft Excel spreadsheet and wishes to find duplicate data values. The data has been organized in a table where each row has different but related forms of data in each column. Which Microsoft Excel function can be used to do this?
- IF
- SUM
- ISNA
- VLOOKUP
Explanation & Hint: VLOOKUP is a very powerful data analysis tool in Microsoft Excel that is used to find information in a large spreadsheet including duplicate values. VLOOKUP is a vertical lookup function, so the data needs to be organized in a table where each row has different but related forms of data in each column.
The IF function makes logical comparisons.
The ISNA looks for cells with #N/A.
The SUM function is used to add the values in cells selected.
-
Refer to the exhibit. A learner is analyzing a data spreadsheet in Microsoft Excel and notices a formula function “=VLOOKUP(B1,$A$2:$A$10,1,FALSE)”. When clicking on cell C2, the value displayed in the field in cell C2 is “#N/A”. Why is this value displayed?
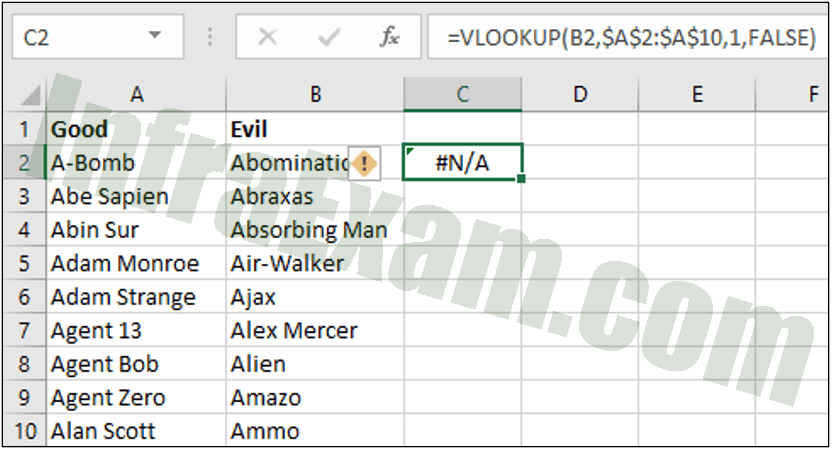
Data Analytics Essentials Course Final Exam Answers 04 - No value is entered in cell C3.
- The cell range is incorrect.
- The formula is entered in the wrong cell.
- No duplicate value for the value entered in cell B2 is found.
Explanation & Hint: VLOOKUP can also be used to help with data cleaning by finding duplicates. With VLOOKUP you can compare two columns (or lists) and find duplicate values. The formula is written in cell C2 as =VLOOKUP(B1,$A$2:$A$10,1,FALSE). This formula compares the value in B1 with the range A2:A10. If there is no duplicate then an error is displayed as “#N/A”. If a duplicate was found it would display the name of the duplicate.
-
Drag the SQL Data Manipulation Language (DML) statements to the correct description.
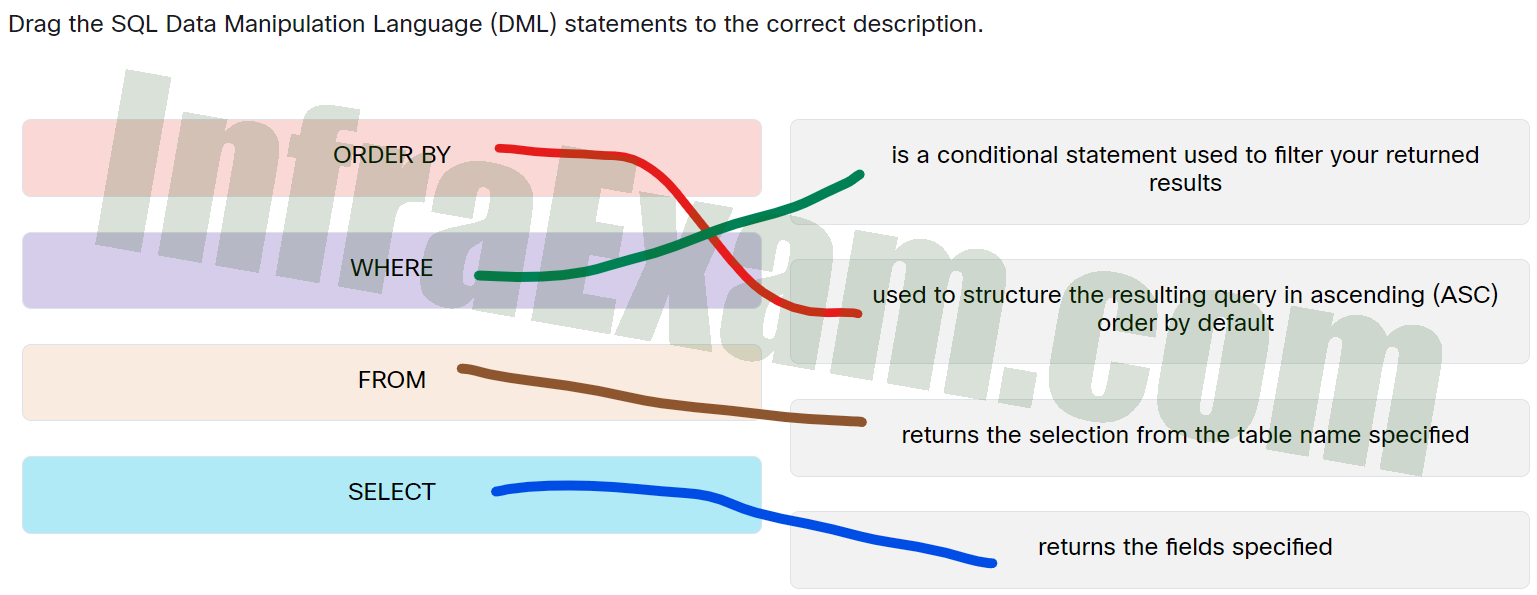
Drag the SQL Data Manipulation Language (DML) statements to the correct description - ORDER BY ==> Used to structure the resulting query in ascending (ASC) order by default
- WHERE ==> Is a conditional statement used to filter your returned results
- FROM ==> Returns the selection from the table name specified
- SELECT ==> Returns the fields specified
Explanation & Hint: Place the options in the following order:
ORDER BY Used to structure the resulting query in ascending (ASC) order by default WHERE Is a conditional statement used to filter your returned results FROM Returns the selection from the table name specified SELECT Returns the fields specified
-
What is referenced by the FROM statement in an SQL query?
- the row where the data is located
- the table containing the data
- the column where the data is located
- the database to be queried
Explanation & Hint: The FROM statement in an SQL query specifies the table where data is stored.
-
Refer to the exhibit. Which option will correctly display the user names and email addresses of users in this table?
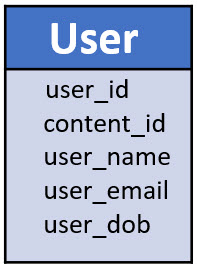
Data Analytics Essentials Course Final Exam Answers 06 - SELECT User
FROM user_id, user_name, user_email - SELECT user_id, user_name, user_email
FROM User - SELECT User
WHERE user_id, user_name, user_email - SELECT user_id, user_name, user_email
WHERE UserExplanation & Hint: The SELECT command is used to request the specified fields using commas to separate fields.
The FROM command returns the selection from the table name.Therefore, the correct answer is:
- SELECT user_id, user_name, user_email
- FROM User
- SELECT User
-
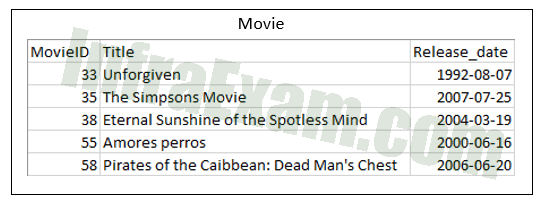
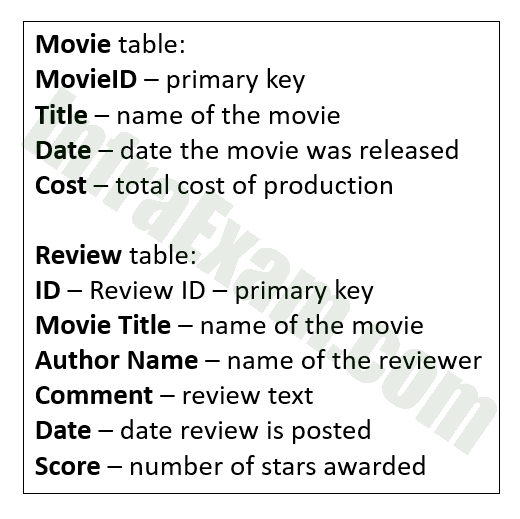
Refer to the exhibit. A portion of the Movie table from the Movies database is shown. A data analyst is writing a query that will return the title and release date of movies released after 2000. The analyst further needs the list ordered by the release date. Which query will return the required results?
Data Analytics Essentials Course Final Exam Answers 02 - SELECT Release_date > ‘2000-12-31’
FROM Title, Release_date
WHERE Movie
ORDER BY Release-date - SELECT Title, Release_date
FROM Movie
WHERE Release_date > ‘2000-12-31’
ORDER BY Release-date - SELECT Movie
FROM Title, Release_date
WHERE Release_date > ‘2000-12-31’
ORDER BY Release-date - SELECT Title, Release_date
FROM Release_date > ‘2000-12-31’
WHERE Movie
ORDER BY Release-dateExplanation & Hint: The correct query is:
SELECT Title, Release_date
FROM Movie
WHERE Release_date > ‘2000-12-31’
ORDER BY Release-dateThe SELECT command indicates the columns
The FROM command indicates the table
The WHERE command indicates the criteria
The ORDER command indicates that result is ordered by release date
- SELECT Release_date > ‘2000-12-31’
-
What is the purpose of the DML language commands in SQL?
- to create, modify or delete objects in the database schema
- to manage updates to the database storage
- to select, update, insert or delete records and values from a table
- to change rights and permissions to data in the database
Explanation & Hint: The Data Manipulation Language stores, modifies, retrieves, and deletes data in a database table. DML includes the most common SQL commands, including SELECT, INSERT, UPDATE and DELETE.
-
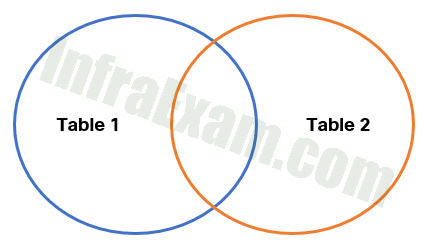
Refer to the exhibit. Match the JOIN operation with the proper description.
Data Analytics Essentials Course Final Exam Answers 07 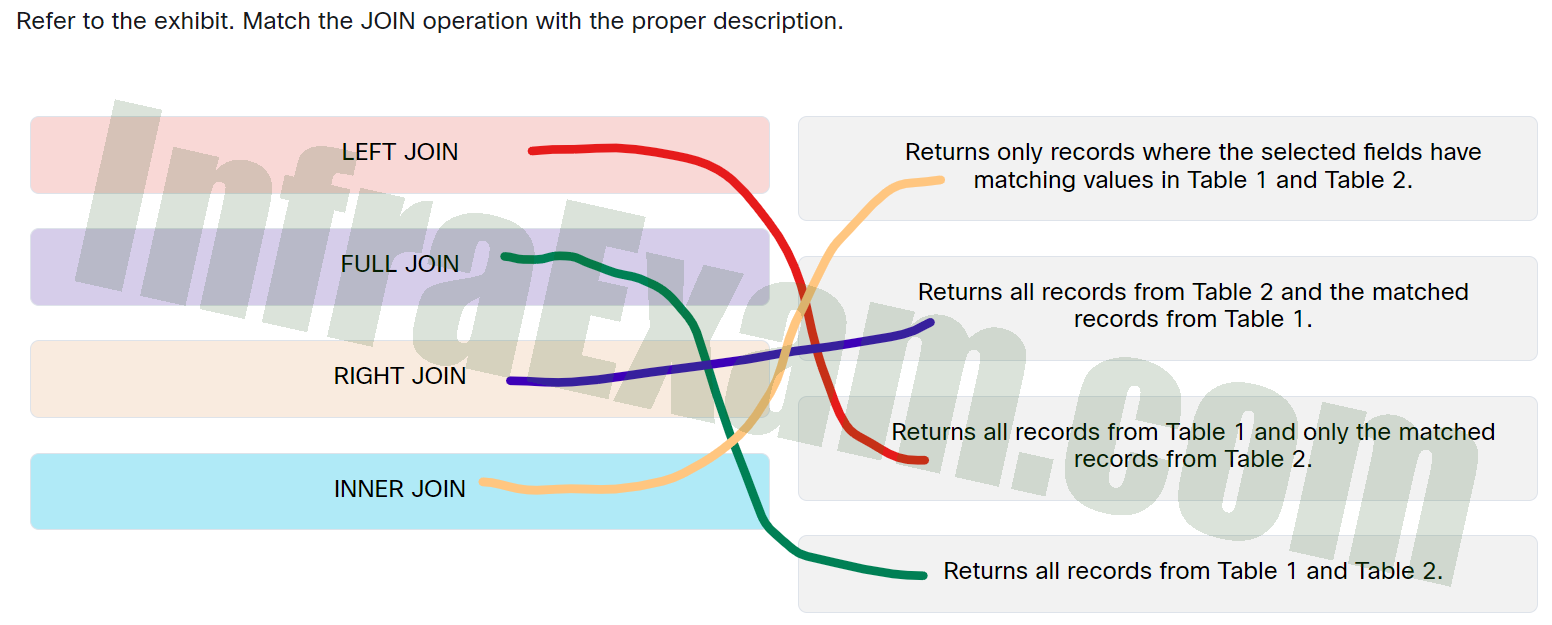
Refer to the exhibit. Match the JOIN operation with the proper description - LEFT JOIN ==> Returns all records from Table 1 and only the matched records from Table 2.
- FULL JOIN ==> Returns all records from Table 1 and Table 2.
- RIGHT JOIN ==> Returns all records from Table 2 and the matched records from Table 1.
- INNER JOIN ==> Returns only records where the selected fields have matching values in Table 1 and Table 2.
Explanation & Hint: Place the options in the following order:
LEFT JOIN Returns all records from Table 1 and only the matched records from Table 2. FULL JOIN Returns all records from Table 1 and Table 2. RIGHT JOIN Returns all records from Table 2 and the matched records from Table 1. INNER JOIN Returns only records where the selected fields have matching values in Table 1 and Table 2.
-
Refer to the exhibit. A data analyst writes a SQL query to extract information from multiple tables in the Movies database. To complete the ON command, what needs to be entered in place of the question mark in this query?
Data Analytics Essentials Course Final Exam Answers 01 SELECT m.Title, m.Date, r.AuthorName, r.Score, r.Comment, r.Date
FROM Review AS r
JOIN Movie AS m
ON m.Title = ?;- r.Date;
- r.Comment;
- r.MovieTitle;
- r.ID;
- r.Score;
Explanation & Hint: To combine two tables, a SQL JOIN can use columns containing the same data type and information in both tables. The Title column in the Movie table includes the movie’s name, and the MovieTitle column in the Review table contains the same information. Even though the Date column appears in both tables, it does not have the same information and, therefore, cannot be used in the JOIN.
-
What does a field refer to in database schema terminology?
- a unique record within the database
- a specific attribute of an individual record
- a collection data in rows and columns
- a collection of attributes of an individual item
Explanation & Hint: A field within the database schema refers to a specific attribute of an individual record. Fields are named by column headings. An individual movie title in the Title column would be a field in the movie table.
-
Why would you use Tableau in your data analysis?
- To create visualizations.
- To perform mathematical calculations using formulas and built-in functions.
- To communicate with and query databases.
- To display data in a tabular format.
Explanation & Hint: Tableau is a business intelligence and data visualization tool. With Tableau you can create great and dynamic visualizations.
-
Which two are benefits of organizing information from multiple datasets into a dashboard? (Choose two)
- The information is easily tracked.
- The information is easily secured.
- The information is easily visualized.
- The information is easily analyzed.
Explanation & Hint: There are several benefits to using dashboards to present your data.
- They give you access to data and reports from multiple data sources on a single screen simplifying data analysis.
- The gamified and dynamic interface is easy to use and understand.
- The information is easily visualized and analyzed.
-
You are preparing a presentation that needs a visualization showing the relative levels of coffee production in the coffee regions of the world. Which type of visualization in Tableau is well suited for displaying this type of data?
- area graph
- bar chart
- heat map
- bubble map
Explanation & Hint: The bubble map is useful for comparing proportions over geographic areas. Circles or dots, which are proportional in size to its value in the dataset, are displayed over a designated geographic region.
-
What Tableau Public feature is used to consolidate multiple views and visualizations?
- objects
- worksheets
- screens
- dashboards
Explanation & Hint: In Tableau, using a dashboard is a way to display information that consolidates multiple views or visualizations.
-
A data analyst conducting a study stops collecting more data once the evidence starts to support the hypothesis. What type of bias has the analyst introduced into the findings?
- information
- interpretation
- selection
- confirmation
Explanation & Hint: Confirmation bias can occur when an analyst only collects or analyzes data that supports a particular hypothesis.
-
Which statement is true in respect of avoiding bias in data analytics?
- focus on the larger patterns and trends and include outliers in the overall analysis
- avoid selecting only data and methods that support your assumptions
- don’t allow the data to confirm your conclusions
- use a small sample set that supports your hypothesis
Explanation & Hint: Some ways to avoid bias in data analytics include:
- Be aware that bias exists. Record your assumptions and hypotheses before beginning your analysis. Avoid selecting only data and methods that support your assumptions.
- Validate your data sources and the methodology used to collect the data.
- Focus on the larger patterns and trends, remove outliers from the overall analysis in order to investigate them further.
- Review your methods and data with others in your team. They may be able to spot bias that you may have overlooked.
- Be open-minded and impartial in your analysis. Allow the data to inform your conclusions.
-
What assurance does data integrity provide?
- Data is unaltered in transit.
- Data is available when requested.
- Data is recoverable.
- Data access is restricted.
Explanation & Hint: Data integrity ensures that data is unaltered in transit. With data integrity there is confidence that the data is accurate, consistent, and trustworthy. Cryptographic hashing functions are used to ensure data integrity.
-
Which type of bias in data analysis can be caused by the influence of outliers?
- selection
- information
- interpretation
- confirmation
Explanation & Hint: Information bias can occur when outliers are present in the data and they are not dealt with appropriately. Outliers can skew the outcomes of analysis and distort the results.
-
Which data analytic tool can create interactive documents containing executable program code and markdown text?
- Kaggle
- Tableau
- Jupyter Notebooks
- Excel
Explanation & Hint: Jupyter notebook is a web-based interactive computing platform. It is a valuable tool for data analysts that provides a way to run code interactively within a web browser. It also includes markdown text to explain what the code is doing.
-
What are the three functions of programming languages optimized for data analysis? (Choose three)
- data visualization
- data communications across networks
- data cleaning
- virtualization of processing hardware
- fast response time to user input
- statistical analysis
Explanation & Hint: Network communication, hardware virtualization, and fast response times are not functions that programming languages optimized for data analysis are expected to perform.
-
Which three features should your data project portfolio contain to ensure that it is considered favorably by employers and recruiters? (Choose three.)
- it contains many multi-colored charts and graphics that show the results of the data analysis
- there are links to software, so non-technical reviewers can replicate your analysis
- there are links to all your projects on the homepage
- it is organized and easy to navigate
- each project has a clear outcome or conclusion
- it uses a layout and presentation that showcases your web design and markup skills
Explanation & Hint: A project portfolio should present those data projects you want to showcase in a well-organized and easy-to-navigate format. Non-technical reviewers will probably need to gain the skills or knowledge and the need to use software to replicate your analysis. A data project portfolio should focus on the processes and outcomes of your projects, not your web design and markup skills. Extensive use of multi-colored charts and graphics in your portfolio will detract from the content you want to showcase.
-
Which feature of Python reduces the coding requirements when data tasks such as exploratory data analysis and machine learning are required?
- Python code based on common English words.
- It is free and open source.
- The availability of code libraries such as NumPy and Scikit-learn.
- It is both an interpreted and object-oriented language.
- It uses dynamic data typing.
Explanation & Hint: The availability of code libraries such as NumPy and Scikit-learn reduces the coding effort when using Python programs to perform data tasks such as exploratory data analysis and machine learning. All the other options are general features of Python that are not necessarily related to data analysis.
-
Which action is taken during the data investigation step of the data analysis lifecycle?
- Identify patterns, relationships, and correlations in the data.
- Determine if the data is complete and relevant for the analysis.
- Transform the data into a format appropriate for the analysis methods and tools.
- Determine if there is enough data to complete the analysis.
In the data investigation step of the lifecycle, data analysts will determine if the data set is complete and contains the relevant information needed for analysis.Explanation & Hint: In the data investigation step of the lifecycle, data analysts will determine if the data set is complete and contains the relevant information needed for analysis.
-
Which Microsoft Excel formula would correctly multiply a value in cell A1 with a value in cell A19?
- =xA1:A19
- =A1xA19
- =MULTIPLY(A1:A19)
- =A1*A19
Explanation & Hint: The formula =A1*A19 takes the value in cell A1 and multiplies it with the value in cell A19. The symbol for multiplication in Microsoft Excel is the asterisk (*).
-
An analyst in an online order company is researching products that online customers spend the most time browsing for on the website but do not buy. The result of the analysis will enable the company to release quick discount notices on the website to encourage customers to buy those products. What relevant data is required to do the research?
- customer order history
- brands of products
- inventory of products
- streaming customer-viewing data
Explanation & Hint: The role of time plays an important role in modern data analytics. Businesses rely on real-time data to make quick decisions that will hold the greatest benefits to them. In this case, the customer viewing data can be analyzed against a policy to release discount notices in a timely fashion in order to encourage interested customers to make a purchase.
-
How can data analysts use the Conditional Formatting tool in Excel to aid in data analysis of bike sales records?
- to highlight values in the revenue column that are above average
- to list sales order numbers from lowest to highest
- to separate the contents of the product description column into separate columns
- to show only sales from the United States
Explanation & Hint: By using conditional formatting, a data analyst can highlight cells that contain certain values or that meet certain criteria.
-
What is an outlier in data analytics?
- it is a point in descriptive data that is historical
- it is a point in inferential data that is numeric
- it is a value or data point that varies significantly from others in the data set
- it is a pointer to the sample data set
Explanation & Hint: An outlier is defined as a value or data point varying significantly from the others, either much smaller or much greater. Outliers can lead to anomalies in the results obtained, because they can lead to negative effects on the results of your analysis. Outliers have to be cleaned up before the data set can be used for effective analysis.
-
Match the type of database to the best description.
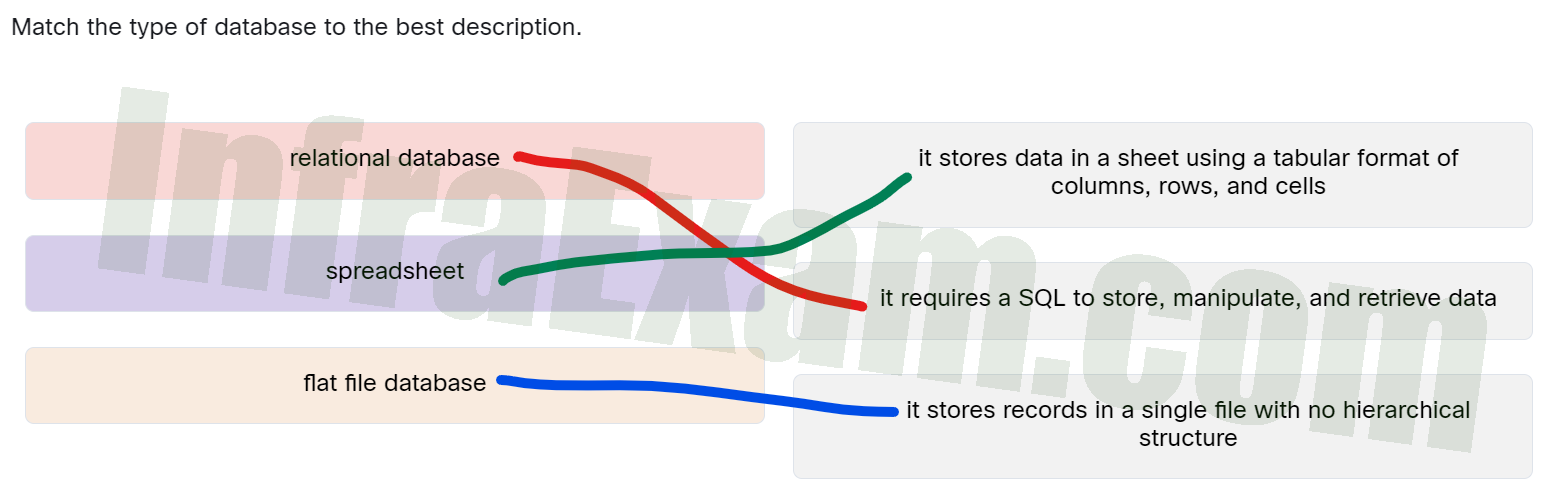
Match the type of database to the best description - relational database ==> It requires a SQL to store, manipulate, and retrieve data
- spreadsheet ==> It stores data in a sheet using a tabular format of columns, rows, and cells
- flat file database ==> It stores records in a single file with no hierarchical structure
Explanation & Hint: Place the options in the following order:
Relational database It requires a SQL to store, manipulate, and retrieve data Spreadsheet It stores data in a sheet using a tabular format of columns, rows, and cells Flat file database It stores records in a single file with no hierarchical structure
-
Match the data analysis tool with the use case.
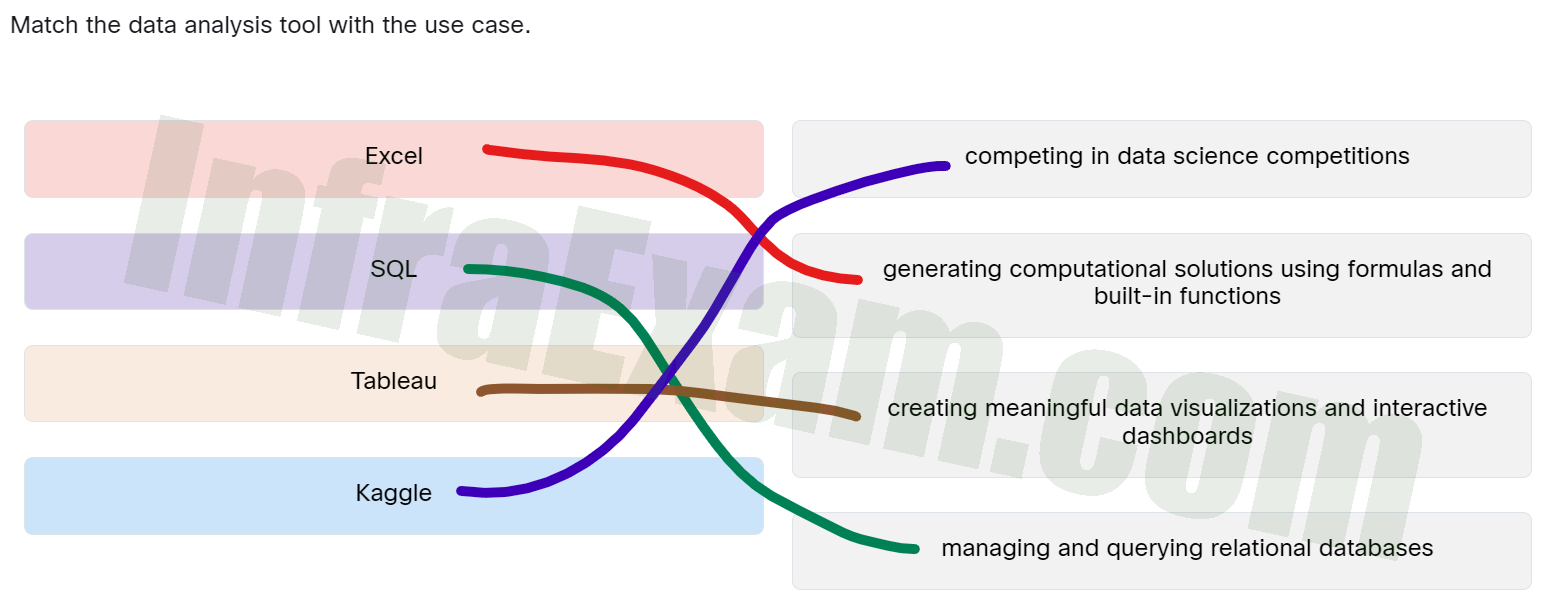
Match the data analysis tool with the use case - Excel ==> Generating computational solutions using formulas and built-in functions
- SQL ==> Managing and querying relational databases
- Tableau ==> Creating meaningful data visualizations and interactive dashboards
- Kaggle ==> Competing in data science competitions
Explanation & Hint: Place the options in the following order:
Excel Generating computational solutions using formulas and built-in functions SQL Managing and querying relational databases Tableau Creating meaningful data visualizations and interactive dashboards Kaggle Competing in data science competitions
-
Why is the Jupyter Notebook tool useful when developing and testing data analysis software?
- program execution output is displayed dynamically in real-time
- markdown text explains the operation of SQL queries and displays the results
- program output is displayed in the standalone Jupyter Notebook application
- when the Python code is compiled, each step is displayed
Explanation & Hint: Python code is interpreted and not compiled. Jupyter Notebook runs code interactively within a web browser and not in a standalone application. SQL queries are applied to relational databases and not to Jupyter Notebooks. A Notebook’s displayed output results from executed code execution in real time.
-
What are three resources provided by the Kaggle web site? (Choose three.)
- data analysis integration with Excel
- data analysis integration with Tableau
- API for major social media networks
- publicly available datasets
- community competitions
- code
Explanation & Hint: Kaggle offers many resources for new and advanced data scientists. These include publicly available data sets, code, community, inspiration, competitions, and courses.
-
What are two methods that ensure confidentiality? (Choose two.)
- nonrepudiation
- authorization
- availability
- integrity
- encryption
- authentication
Explanation & Hint: Confidentiality means viewing of information only for those who need to know. This can be accomplished by encrypting data and authenticating users who request access.