AZ-400 : Microsoft Azure DevOps Solutions : Part 02
-
HOTSPOT
You have a project in Azure DevOps named Contoso App that contains pipelines in Azure Pipelines for GitHub repositories.
You need to ensure that developers receive Microsoft Teams notifications when there are failures in a pipeline of Contoso App.
What should you run in Teams? To answer, select the appropriate options in the answer area.
NOTE: Each correct selection is worth one point.

AZ-400 Microsoft Azure DevOps Solutions Part 02 Q01 016 Question 
AZ-400 Microsoft Azure DevOps Solutions Part 02 Q01 016 Answer Explanation:Box 1: subscribe
To start monitoring all pipelines in a project, use the following command inside a channel:@azure pipelines subscribe [project url]
Box 2: https://dev.azure.com/contoso/contoso-app/
Subscribe to a pipeline or all pipelines in a project to receive notifications:
@azure pipelines subscribe [pipeline url/ project url] -
You have a private GitHub repository.
You need to display the commit status of the repository on Azure Boards.
What should you do first?
- Configure multi-factor authentication (MFA) for your GitHub account.
- Add the Azure Pipelines app to the GitHub repository.
- Add the Azure Boards app to the repository.
- Create a GitHub action in GitHub.
Explanation:To connect Azure Boards to GitHub.com, connect and configure from Azure Boards. Or, alternatively, install and configure the Azure Boards app from GitHub. Both methods have been streamlined and support authenticating and operating via the app rather than an individual.
Note (see step 4 below):
Add a GitHub connection:
1. Sign into Azure Boards.
2. Choose (1) Project Settings, choose (2) GitHub connections and then (3) Connect your GitHub account.
3. If this is your first time connecting to GitHub from Azure Boards, you will be asked to sign in using your GitHub credentials. Choose an account for which you are an administrator for the repositories you want to connect to.
4. The Add GitHub Repositories dialog automatically displays and selects all GitHub.com repositories for which you are an administrator. Unselect any repositories that you don’t want to participate in the integration.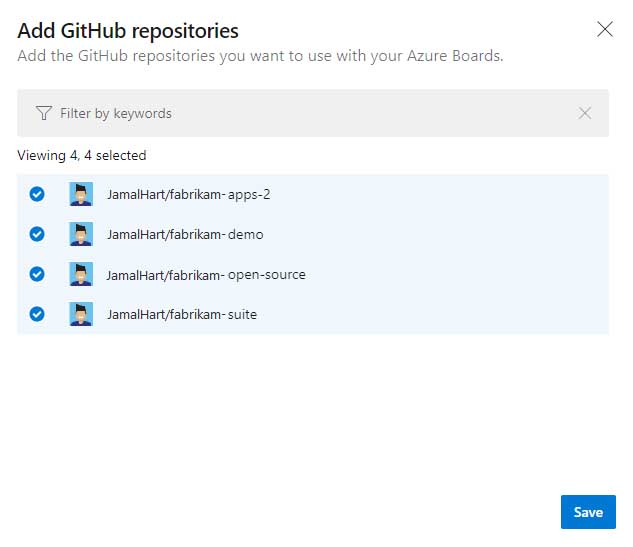
AZ-400 Microsoft Azure DevOps Solutions Part 02 Q02 017 -
You are integrating Azure Pipelines and Microsoft Teams.
You install the Azure Pipelines app in Microsoft Teams.
You have an Azure DevOps organization named Contoso that contains a project name Project1.
You subscribe to Project1 in Microsoft Teams.
You need to ensure that you only receive events about failed builds in Microsoft Teams.
What should you do first?
- From Microsoft Teams, run @azure pipelines subscribe https://dev.azure.com/Contoso/Project1.
- From Azure Pipelines, add a Publish Build Artifacts task to Project1.
- From Microsoft Teams, run @azure pipelines subscriptions.
- From Azure Pipelines, enable continuous integration for Project1.
Explanation:To start monitoring all pipelines in a project, use the following command inside a channel:
@azure pipelines subscribe [project url]
The project URL can be to any page within your project (except URLs to pipelines).For example:
@azure pipelines subscribe https://dev.azure.com/myorg/myproject/ -
You have an Azure DevOps organization named Contoso.
You need to receive Microsoft Teams notifications when work items are updated.
What should you do?
- From Azure DevOps, configure a service hook subscription
- From Microsoft Teams, configure a connector
- From the Microsoft Teams admin center, configure external access
- From Microsoft Teams, add a channel
- From Azure DevOps, install an extension
Explanation:Service hooks let you run tasks on other services when events happen in your Azure DevOps projects. For example, create a card in Trello when a work item is created or send a push notification to your team’s mobile devices when a build fails. You can also use service hooks in custom apps and services as a more efficient way to drive activities when events happen in your projects.
Note: Service hook publishers define a set of events. Subscriptions listen for the events and define actions to take based on the event. Subscriptions also target consumers, which are external services that can run their own actions, when an event occurs.
-
You create an alert rule in Azure Monitor as shown in the following exhibit.
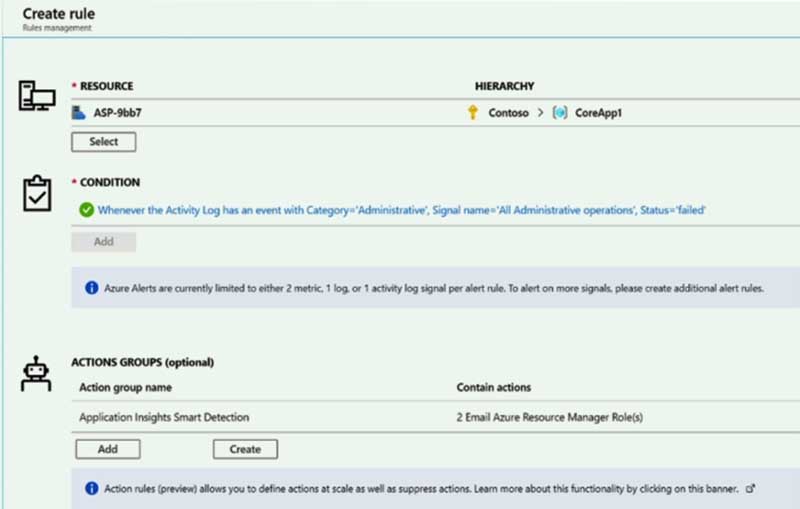
AZ-400 Microsoft Azure DevOps Solutions Part 02 Q05 018 Which action will trigger an alert?
- a failed attempt to delete the ASP-9bb7 resource
- a change to a role assignment for the ASP-9bb7 resource
- a successful attempt to delete the ASP-9bb7 resource
- a failed attempt to scale up the ASP-9bb7 resource
-
You have a web app hosted on Azure App Service. The web app stores data in an Azure SQL database.
You need to generate an alert when there are 10,000 simultaneous connections to the database. The solution must minimize development effort.
Which option should you select in the Diagnostics settings of the database?
- Send to Log Analytics
- Stream to an event hub
- Archive to a storage account
Explanation:ENABLE DIAGNOSTICS TO LOG ANALYTICS
This configuration is done PER DATABASE
1. Click on Diagnostics Settings and then Turn On Diagnostics
AZ-400 Microsoft Azure DevOps Solutions Part 02 Q06 019 2. Select to Send to Log Analytics and select the Log Analytics workspace. For this sample I will selected only Errors

AZ-400 Microsoft Azure DevOps Solutions Part 02 Q06 020 -
HOTSPOT
You use Azure DevOps to manage the build and deployment of an app named App1.
You have a release pipeline that deploys a virtual machine named VM1.
You plan to monitor the release pipeline by using Azure Monitor.
You need to create an alert to monitor the performance of VM1. The alert must be triggered when the average CPU usage exceeds 70 percent for five minutes. The alert must calculate the average once every minute.
How should you configure the alert rule? To answer, select the appropriate options in the answer area.
NOTE: Each correct selection is worth one point.
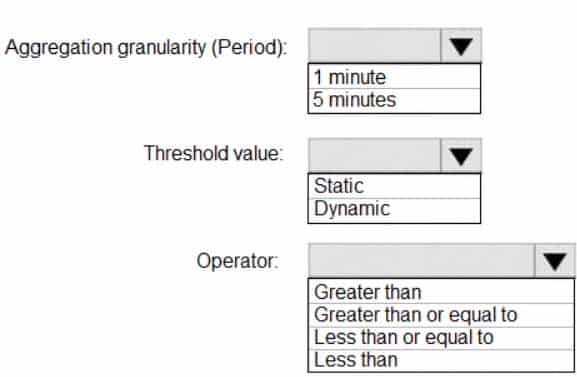
AZ-400 Microsoft Azure DevOps Solutions Part 02 Q07 021 Question 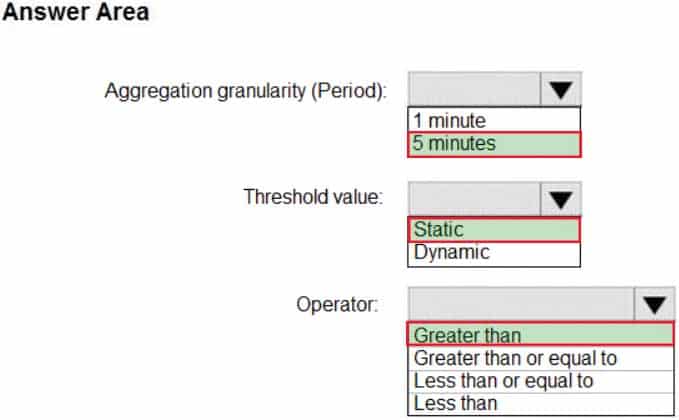
AZ-400 Microsoft Azure DevOps Solutions Part 02 Q07 021 Answer Explanation:Box 1: 5 minutes
The alert must calculate the average once every minute.Note: We [Microsoft] recommend choosing an Aggregation granularity (Period) that is larger than the Frequency of evaluation, to reduce the likelihood of missing the first evaluation of added time series
Box 2: Static
Box 3: Greater than
Example, say you have an App Service plan for your website. You want to monitor CPU usage on multiple instances running your web site/app. You can do that using a metric alert rule as follows:
– Target resource: myAppServicePlan
– Metric: Percentage CPU
– Condition Type: Static
– Dimensions
– Instance = InstanceName1, InstanceName2
– Time Aggregation: Average
– Period: Over the last 5 mins
– Frequency: 1 min
– Operator: GreaterThan
– Threshold: 70
– Like before, this rule monitors if the average CPU usage for the last 5 minutes exceeds 70%.
– Aggregation granularity -
Case Study
This is a case study. Case studies are not timed separately. You can use as much exam time as you would like to complete each case. However, there may be additional case studies and sections on this exam. You must manage your time to ensure that you are able to complete all questions included on this exam in the time provided.
To answer the questions included in a case study, you will need to reference information that is provided in the case study. Case studies might contain exhibits and other resources that provide more information about the scenario that is described in the case study. Each question is independent of the other questions in this case study.
At the end of this case study, a review screen will appear. This screen allows you to review your answers and to make changes before you move to the next section of the exam. After you begin a new section, you cannot return to this section.
To start the case study
To display the first question in this case study, click the Next button. Use the buttons in the left pane to explore the content of the case study before you answer the questions. Clicking these buttons displays information such as business requirements, existing environment, and problem statements. If the case study has an All Information tab, note that the information displayed is identical to the information displayed on the subsequent tabs. When you are ready to answer a question, click the Question button to return to the question.Overview
General Overview
Woodgrove Bank is a financial services company that has a main office in the United Kingdom.
Technical Requirements and Planned Changes
Planned Changes
Woodgrove Bank plans to implement the following project management changes:
– Implement Azure DevOps for project tracking.
– Centralize source code control in private GitHub repositories.
– Implement Azure Pipelines for build pipelines and release pipelines.Woodgrove Bank plans to implement the following changes to the identity environment:
– Deploy an Azure AD tenant named woodgrovebank.com.
– Sync the Active Directory domain to Azure AD.
– Configure App1 to use a service principal.
– Integrate GitHub with Azure AD.Woodgrove Bank plans to implement the following changes to the core apps:
– Migrate App1 to ASP.NET Core.
– Integrate Azure Pipelines and the third-party build tool used to develop App2.Woodgrove Bank plans to implement the following changes to the DevOps environment:
– Deploy App1 to Azure App Service.
– Implement source control for the DB1 schema.
– Migrate all the source code from TFS1 to GitHub.
– Deploy App2 to an Azure virtual machine named VM1.
– Merge the POC branch into the GitHub default branch.
– Implement an Azure DevOps dashboard for stakeholders to monitor development progress.Technical Requirements
Woodgrove Bank identifies the following technical requirements:
– The initial databases for new environments must contain both schema and reference data.
– An Azure Monitor alert for VM1 must be configured to meet the following requirements:
– Be triggered when average CPU usage exceeds 80 percent for 15 minutes.
– Calculate CPU usage averages once every minute.
– The commit history of the POC branch must replace the history of the default branch.
– The Azure DevOps dashboard must display the metrics shown in the following table.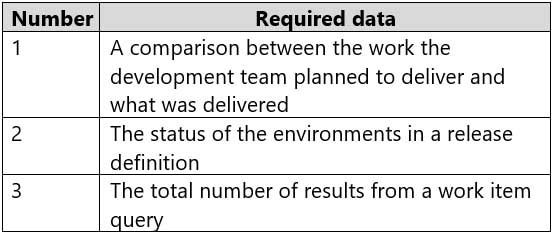
AZ-400 Microsoft Azure DevOps Solutions Part 02 Q08 022 – Access to Azure DevOps must be restricted to specific IP addresses.
– Page load times for App1 must be captured and monitored.
– Administrative effort must be minimized.-
HOTSPOT
You need to configure the alert for VM1. The solution must meet the technical requirements.
Which two settings should you configure? To answer, select the appropriate settings in the answer area.
NOTE: Each correct selection is worth one point.
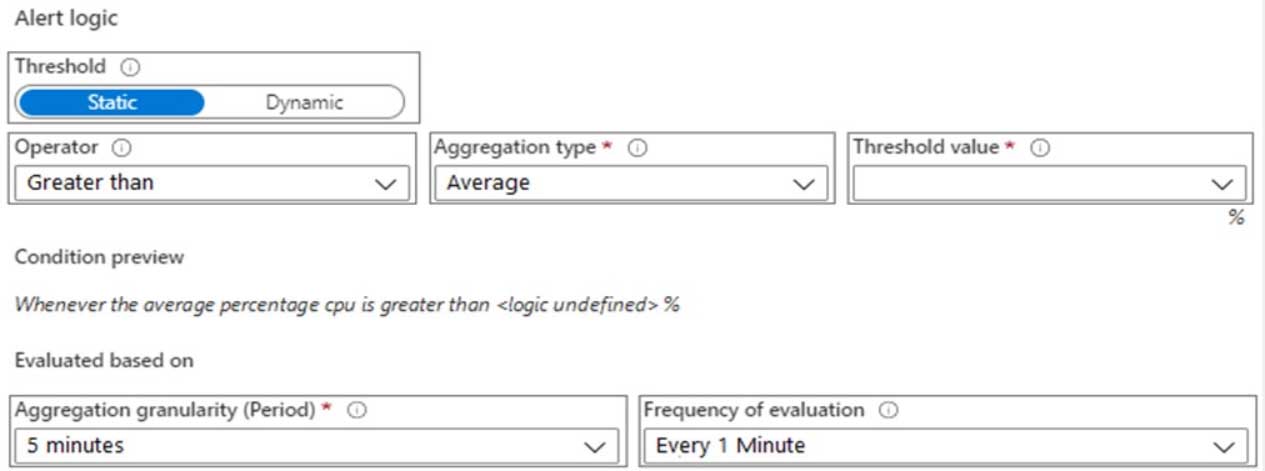
AZ-400 Microsoft Azure DevOps Solutions Part 02 Q08 023 Question 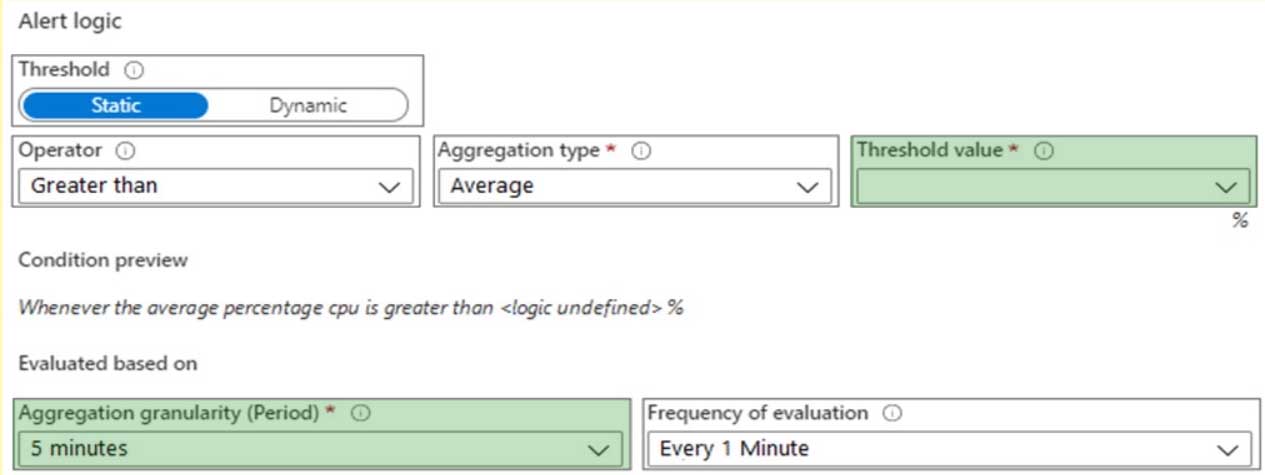
AZ-400 Microsoft Azure DevOps Solutions Part 02 Q08 023 Answer Explanation:Setting 1: Threshold value
Set to 80 %Scenario: An Azure Monitor alert for VM1 must be configured to meet the following requirements:
– Be triggered when average CPU usage exceeds 80 percent for 15 minutes.
– Calculate CPU usage averages once every minute.Setting 2: Aggregation granularity
Set to 15 minutes.
-
-
DRAG DROP
You are planning projects for three customers. Each customer’s preferred process for work items is shown in the following table.

AZ-400 Microsoft Azure DevOps Solutions Part 02 Q09 024 The customers all plan to use Azure DevOps for work item management.
Which work item process should you use for each customer? To answer, drag the appropriate work item processes to the correct customers. Each work item process may be used once, more than once, or not at all. You may need to drag the split bar between panes or scroll to view content.
NOTE: Each correct selection is worth one point.

AZ-400 Microsoft Azure DevOps Solutions Part 02 Q09 025 Question 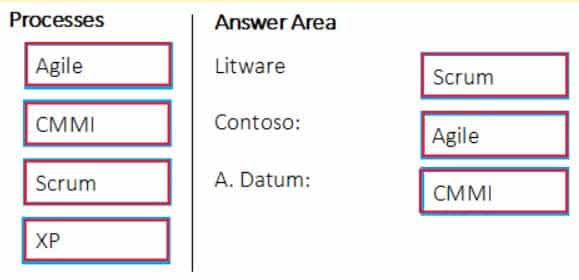
AZ-400 Microsoft Azure DevOps Solutions Part 02 Q09 025 Answer Explanation:Box 1: Scrum
Choose Scrum when your team practices Scrum. This process works great if you want to track product backlog items (PBIs) and bugs on the Kanban board, or break PBIs and bugs down into tasks on the taskboard.Box 2: Agile
Choose Agile when your team uses Agile planning methods, including Scrum, and tracks development and test activities separately. This process works great if you want to track user stories and (optionally) bugs on the Kanban board, or track bugs and tasks on the taskboard.Box 3: CMMI
Choose CMMI when your team follows more formal project methods that require a framework for process improvement and an auditable record of decisions. With this process, you can track requirements, change requests, risks, and reviews.Incorrect Answers:
XP:
The work tracking objects contained within the default DevOps processes and DevOps process templates are Basic, Agile, CMMI, and Scrum
XP (Extreme Programming) and DevOps are different things. They don’t contradict with each other, they can be used together, but they have different base concepts inside them. -
You configure an Azure Application Insights availability test.
You need to notify the customer services department at your company by email when availability is degraded.
You create an Azure logic app that will handle the email and follow up actions.
Which type of trigger should you use to invoke the logic app?
- an HTTPWebhook trigger
- an HTTP trigger
- a Request trigger
- an ApiConnection trigger
Explanation:
You can use webhooks to route an Azure alert notification to other systems for post-processing or custom actions. You can use a webhook on an alert to route it to services that send SMS messages, to log bugs, to notify a team via chat or messaging services, or for various other actions. -
You have an Azure DevOps organization named Contoso and an Azure subscription.
You use Azure DevOps to build a containerized app named App1 and deploy App1 to an Azure container instance named ACI1.
You need to restart ACI1 when App1 stops responding.
What should you do?
- Add a liveness probe to the YAML configuration of App1.
- Add a readiness probe to the YAML configuration of App1.
- Use Connection Monitor in Azure Network Watcher.
- Use IP flow verify in Azure Network Watcher.
Explanation:For containerized applications that serve traffic, you might want to verify that your container is ready to handle incoming requests. Azure Container Instances supports readiness probes to include configurations so that your container can’t be accessed under certain conditions. The readiness probe behaves like a Kubernetes readiness probe. For example, a container app might need to load a large data set during startup, and you don’t want it to receive requests during this time.
YAML is used to setup a liveness probe.
-
You have a multi-tier application that has an Azure Web Apps front end and an Azure SQL Database back end.
You need to recommend a solution to capture and store telemetry data. The solution must meet the following requirements:
– Support using ad-hoc queries to identify baselines.
– Trigger alerts when metrics in the baseline are exceeded.
– Store application and database metrics in a central location.What should you include in the recommendation?
- Azure Event Hubs
- Azure SQL Database Intelligent Insights
- Azure Application Insights
- Azure Log Analytics
Explanation:Azure Platform as a Service (PaaS) resources, like Azure SQL and Web Sites (Web Apps), can emit performance metrics data natively to Log Analytics.
The Premium plan will retain up to 12 months of data, giving you an excellent baseline ability.
There are two options available in the Azure portal for analyzing data stored in Log analytics and for creating queries for ad hoc analysis.Incorrect Answers:
B: Intelligent Insights analyzes database performance by comparing the database workload from the last hour with the past seven-day baseline workload. However, we need handle application metrics as well. -
You have an Azure DevOps organization named Contoso and an Azure subscription. The subscription contains an Azure virtual machine scale set named VMSS1 that is configured for autoscaling.
You use Azure DevOps to build a web app named App1 and deploy App1 to VMSS1. App1 is used heavily and has usage patterns that vary on a weekly basis.
You need to recommend a solution to detect an abnormal rise in the rate of failed requests to App1. The solution must minimize administrative effort.
What should you include in the recommendation?
- the Smart Detection feature in Azure Application Insights
- the Failures feature in Azure Application Insights
- an Azure Service Health alert
- an Azure Monitor alert that uses an Azure Log Analytics query
Explanation:
After setting up Application Insights for your project, and if your app generates a certain minimum amount of data, Smart Detection of failure anomalies takes 24 hours to learn the normal behavior of your app, before it is switched on and can send alerts. -
SIMULATION
You need to ensure that Microsoft Visual Studio 2017 can remotely attach to an Azure Function named fa-11566895.
To complete this task, sign in to the Microsoft Azure portal.
- See explanation below.
Explanation:Enable Remote Debugging
Before we start a debugging session to our Azure Function app we need to enable the functionality.1. Navigate in the Azure portal to your function app fa-11566895
2. Go to the “Application settings”
3. Under “Debugging” set Remote Debugging to On and set Remote Visual Studio version to 2017. -
You have an Azure subscription that contains resources in several resource groups.
You need to design a monitoring strategy that will provide a consolidated view. The solution must support the following requirements:
– Support role-based access control (RBAC) by using Azure Active Directory (Azure AD) identifies.
– Include visuals from Azure Monitor that are generated by using the Kusto query language.
– Support documentation written in markdown.
– Use the latest data available for each visual.What should you use to create the consolidated view?
- Azure Monitor
- Microsoft Power BI
- Azure Data Explorer
- Azure dashboards
Explanation:There are several tools available for running queries in Azure Data Explorer, including Kusto.
Kusto uses a role-based access control (RBAC) model, under which authenticated principals are mapped to roles, and get access according to the roles they’re assigned.
Note: Azure Data Explorer is a highly scalable and secure analytics service that enables you to do rich exploration of structured and unstructured data for instant insights. Optimized for ad-hoc queries, Azure Data Explorer enables rich data exploration over raw, structured, and semi-structured data delivering fast time to insight. Query with a modern, intuitive query language that offers fast, ad-hoc, and advanced query capabilities over high-rate data volumes and varieties
-
You are automating the testing process for your company.
You need to automate UI testing of a web application.
Which framework should you use?
- JaCoco
- Selenium
- Xamarin.UITest
- Microsoft.CodeAnalysis
Explanation:
Performing user interface (UI) testing as part of the release pipeline is a great way of detecting unexpected changes, and need not be difficult. Selenium can be used to test your website during a continuous deployment release and test automation. -
You are building an ASP.NET Core application.
You plan to create an application utilization baseline by capturing telemetry data.
You need to add code to the application to capture the telemetry data. The solution must minimize the costs of storing the telemetry data.
Which two actions should you perform? Each correct answer presents part of the solution.
NOTE: Each correct selection is worth one point
- Add the <InitialSamplingPercentage>99</InitialSamplingPercentage> parameter to the ApplicationInsights.config file.
- From the code of the application, enable adaptive sampling.
- From the code of the application, add Azure Application Insights telemetry.
- Add the <MaxTelemetryItemsPerSecond>5</MaxTelemetryItemsPerSecond> parameter to the ApplicationInsights.config file.
- From the code of the application, disable adaptive sampling.
Explanation:Sampling is a feature in Azure Application Insights. It is the recommended way to reduce telemetry traffic, data costs, and storage costs, while preserving a statistically correct analysis of application data.
The Application Insights SDK for ASP.NET Core supports both fixed-rate and adaptive sampling. Adaptive sampling is enabled by default.
D: For adaptive sampling: The volume is adjusted automatically to keep within a specified maximum rate of traffic, and is controlled via the setting MaxTelemetryItemsPerSecond. If the application produces a low amount of telemetry, such as when debugging or due to low usage, items won’t be dropped by the sampling processor as long as volume is below MaxTelemetryItemsPerSecond.
Note: In ApplicationInsights.config, you can adjust several parameters in the AdaptiveSamplingTelemetryProcessor node. The figures shown are the default values:
<MaxTelemetryItemsPerSecond>5</MaxTelemetryItemsPerSecond>
-
You have an Azure DevOps organization named Contoso and an Azure subscription. The subscription contains an Azure virtual machine scale set named VMSS1 and an Azure Standard Load Balancer named LB1. LB1 distributes incoming requests across VMSS1 instances.
You use Azure DevOps to build a web app named App1 and deploy App1 to VMSS1. App1 is accessible via HTTPS only and configured to require mutual authentication by using a client certificate.
You need to recommend a solution for implementing a health check of App1. The solution must meet the following requirements:
– Identify whether individual instances of VMSS1 are eligible for an upgrade operation.
– Minimize administrative effort.What should you include in the recommendation?
- an Azure Load Balancer health probe
- Azure Monitor autoscale
- the Custom Script Extension
- the Application Health extension
Explanation:
Monitoring your application health is an important signal for managing and upgrading your deployment. Azure virtual machine scale sets provide support for rolling upgrades including automatic OS-image upgrades, which rely on health monitoring of the individual instances to upgrade your deployment. You can also use health extension to monitor the application health of each instance in your scale set and perform instance repairs using automatic instance repairs. -
HOTSPOT
You have an application named App1 that has a custom domain of app.contoso.com.
You create a test in Azure Application Insights as shown in the following exhibit.
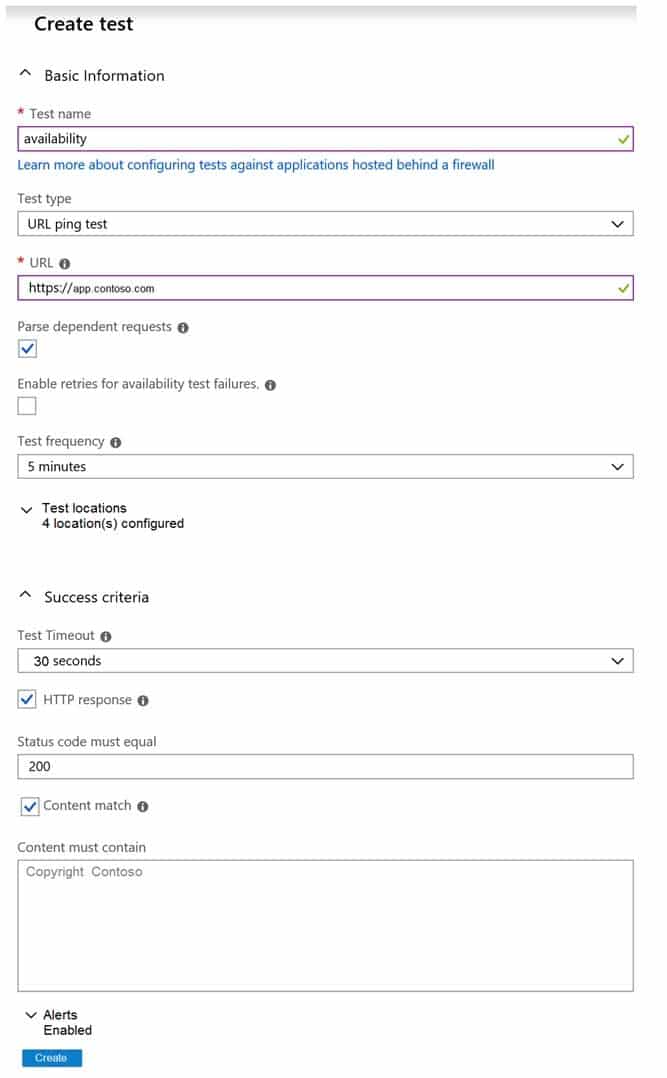
AZ-400 Microsoft Azure DevOps Solutions Part 02 Q19 026 Use the drop-down menus to select the answer choice that completes each statement based on the information presented in the graphic.
NOTE: Each correct selection is worth one point.

AZ-400 Microsoft Azure DevOps Solutions Part 02 Q19 027 Question 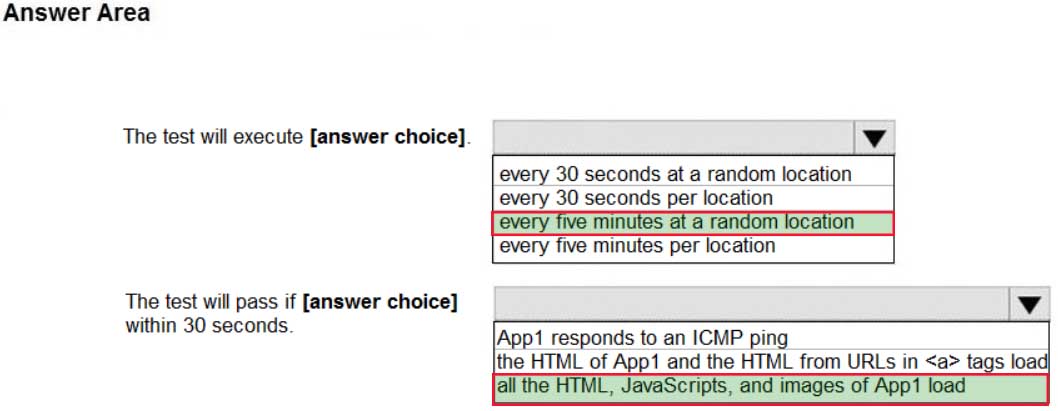
AZ-400 Microsoft Azure DevOps Solutions Part 02 Q19 027 Answer Explanation:Box 1: every five minutes at a random location
Test frequency: Sets how often the test is run from each test location. With a default frequency of five minutes and five test locations, your site is tested on average every minute.Box 2:
Parse dependent requests: Test requests images, scripts, style files, and other files that are part of the web page under test. The recorded response time includes the time taken to get these files. The test fails if any of these resources cannot be successfully downloaded within the timeout for the whole test. -
You have a build pipeline in Azure Pipelines that occasionally fails.
You discover that a test measuring the response time of an API endpoint causes the failures.
You need to prevent the build pipeline from failing due to the test.
Which two actions should you perform? Each correct answer presents part of the solution.
NOTE: Each correct selection is worth one point.
- Set Flaky test detection to Off.
- Clear Flaky tests included in test pass percentage.
- Enable Test Impact Analysis (TIA).
- Manually mark the test as flaky.
- Enable test slicing.
Explanation:D: You can mark or unmark a test as flaky based on analysis or context, by choosing Flaky.
To configure flaky test management, choose Project settings, and select Test management in the Pipelines section.
B:
Slide the On/Off button to On.
AZ-400 Microsoft Azure DevOps Solutions Part 02 Q20 028