DA-100 : Analyzing Data with Microsoft Power BI : Part 02
-
Note: This question is part of a series of questions that present the same scenario. Each question in the series contains a unique solution that might meet the stated goals. Some question sets might have more than one correct solution, while others might not have a correct solution.
After you answer a question in this section, you will NOT be able to return to it. As a result, these questions will not appear in the review screen.
You are modeling data by using Microsoft Power BI. Part of the data model is a large Microsoft SQL Server table named Order that has more than 100 million records.
During the development process, you need to import a sample of the data from the Order table.
Solution: You add a WHERE clause to the SQL statement.
Does this meet the goal?
- Yes
- No
Explanation:The WHERE clause has its effects before the data is imported. -
Note: This question is part of a series of questions that present the same scenario. Each question in the series contains a unique solution that might meet the stated goals. Some question sets might have more than one correct solution, while others might not have a correct solution.
After you answer a question in this section, you will NOT be able to return to it. As a result, these questions will not appear in the review screen.
You create a parameter named Data Source Excel that holds the file name and location of a Microsoft Excel data source.
You need to update the query to reference the parameter instead of multiple hard-coded copies of the location within each query definition.
Solution: In the Power Query M code, you replace references to the Excel file with Data Source Excel.
Does this meet the goal?
- Yes
- No
Explanation:
Instead modify the source step of the queries to use Data Source Excel as the file path.
Note: Parameterising a Data Source could be used in many different use cases. From connecting to different data sources defined in Query Parameters to load different combinations of columns.
-
Note: This question is part of a series of questions that present the same scenario. Each question in the series contains a unique solution that might meet the stated goals. Some question sets might have more than one correct solution, while others might not have a correct solution.
After you answer a question in this section, you will NOT be able to return to it. As a result, these questions will not appear in the review screen.
You create a parameter named Data Source Excel that holds the file name and location of a Microsoft Excel data source.
You need to update the query to reference the parameter instead of multiple hard-coded copies of the location within each query definition.
Solution: You modify the source step of the queries to use Data Source Excel as the file path.
Does this meet the goal?
- Yes
- No
Explanation:
Parameterising a Data Source could be used in many different use cases. From connecting to different data sources defined in Query Parameters to load different combinations of columns. -
Note: This question is part of a series of questions that present the same scenario. Each question in the series contains a unique solution that might meet the stated goals. Some question sets might have more than one correct solution, while others might not have a correct solution.
After you answer a question in this section, you will NOT be able to return to it. As a result, these questions will not appear in the review screen.
You create a parameter named Data Source Excel that holds the file name and location of a Microsoft Excel data source.
You need to update the query to reference the parameter instead of multiple hard-coded copies of the location within each query definition.
Solution: You create a new query that references Data Source Excel.
Does this meet the goal?
- Yes
- No
Explanation:Instead modify the source step of the queries to use Data Source Excel as the file path.
Note: Parameterising a Data Source could be used in many different use cases. From connecting to different data sources defined in Query Parameters to load different combinations of columns.
-
Note: This question is part of a series of questions that present the same scenario. Each question in the series contains a unique solution that might meet the stated goals. Some question sets might have more than one correct solution, while others might not have a correct solution.
After you answer a question in this section, you will NOT be able to return to it. As a result, these questions will not appear in the review screen.
You are modeling data by using Microsoft Power BI. Part of the data model is a large Microsoft SQL Server table named Order that has more than 100 million records.
During the development process, you need to import a sample of the data from the Order table.
Solution: You add a report-level filter that filters based on the order date.
Does this meet the goal?
- Yes
- No
Explanation:
The filter is applied after the data is imported.
Instead add a WHERE clause to the SQL statement. -
Note: This question is part of a series of questions that present the same scenario. Each question in the series contains a unique solution that might meet the stated goals. Some question sets might have more than one correct solution, while others might not have a correct solution.
After you answer a question in this section, you will NOT be able to return to it. As a result, these questions will not appear in the review screen.
You are modeling data by using Microsoft Power BI. Part of the data model is a large Microsoft SQL Server table named Order that has more than 100 million records.
During the development process, you need to import a sample of the data from the Order table.
Solution: You write a DAX expression that uses the FILTER function.
Does this meet the goal?
- Yes
- No
Explanation:
The filter is applied after the data is imported.
Instead add a WHERE clause to the SQL statement. -
You have a Power BI dashboard that monitors the quality of manufacturing processes. The dashboard contains the following elements:
– A line chart that shows the number of defective products manufactured by day.
– A KPI visual that shows the current daily percentage of defective products manufactured.You need to be notified when the daily percentage of defective products manufactured exceeds 3%.
What should you create?
- a Q&A visual
- a subscription
- a smart narrative visual
- an alert
-
DRAG DROP
You are preparing a financial report in Power BI.
You connect to the data stored in a Microsoft Excel spreadsheet by using Power Query Editor as shown in the following exhibit.

DA-100 Analyzing Data with Microsoft Power BI Part 02 Q08 023 You need to prepare the data to support the following:
– Visualizations that include all measures in the data over time
– Year-over-year calculations for all the measuresWhich four actions should you perform in sequence? To answer, move the appropriate actions from the list of actions to the answer area and arrange them in the correct order.

DA-100 Analyzing Data with Microsoft Power BI Part 02 Q08 024 Question 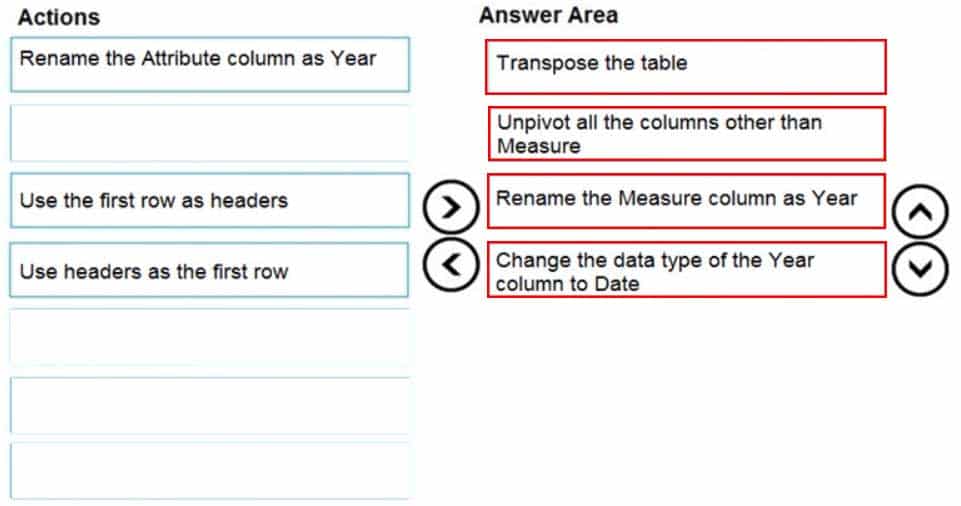
DA-100 Analyzing Data with Microsoft Power BI Part 02 Q08 024 Answer -
HOTSPOT
You have the data lineage shown in the following exhibit.

DA-100 Analyzing Data with Microsoft Power BI Part 02 Q09 025 Use the drop-down menus to select the answer choice that completes each statement based on the information presented in the graphic.
NOTE: Each correct selection is worth one point.
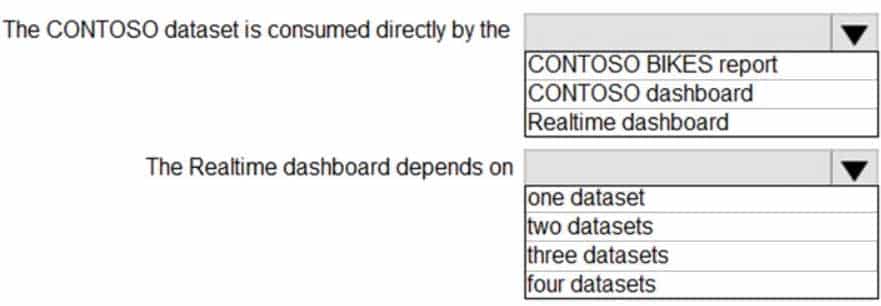
DA-100 Analyzing Data with Microsoft Power BI Part 02 Q09 026 Question 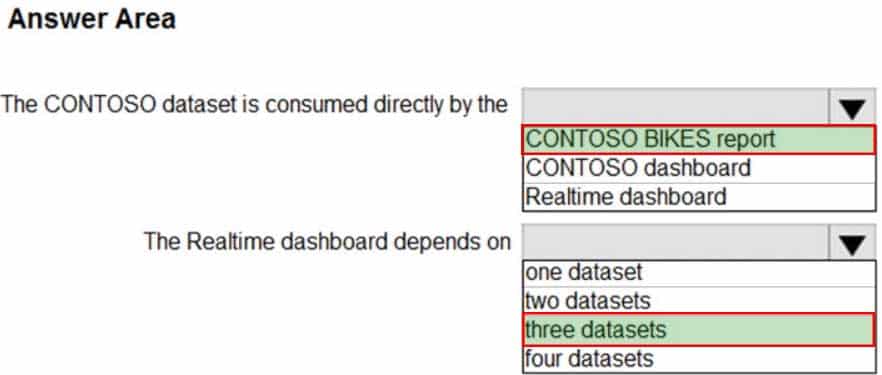
DA-100 Analyzing Data with Microsoft Power BI Part 02 Q09 026 Answer Explanation:Box 1: CONTOSO BIKES report
Box 2: three datasets
Images, tweets and the Contoso datasets. -
You are reviewing a query that produces 10,000 rows in the Power Query Editor.
You need to identify whether a column contains only unique values.
Which two Data Preview options can you use? Each correct answer presents a complete solution.
NOTE: Each correct selection is worth one point.
- Column profile
- Column distribution
- Show whitespace
- Column quality
- Monospaced
Explanation:B: Column distribution: This feature provides a set of visuals underneath the names of the columns that showcase the frequency and distribution of the values in each of the columns. The data in these visualizations is sorted in descending order from the value with the highest frequency.
By hovering over the distribution data in any of the columns, you get information about the overall data in the column (with distinct count and unique values).A: Column profile: This feature provides a more in-depth look at the data in a column [compared to column distribution]. Apart from the column distribution chart, it contains a column statistics chart.
Incorrect Answers:
D: Column quality
The column quality feature labels values in rows in three categories:
– Valid, shown in green
– Error, shown in red
– Empty, shown in dark grey -
HOTSPOT
You have two Azure SQL databases that contain the same tables and columns.
For each database, you create a query that retrieves data from a table named Customer.
You need to determine the Customer tables into a single table. The solution must minimize the size of the data model and support scheduled refresh in powerbi.com.
What should you do? To answer, select the appropriate options in the answer area.
NOTE: Each correct selection is worth one point.
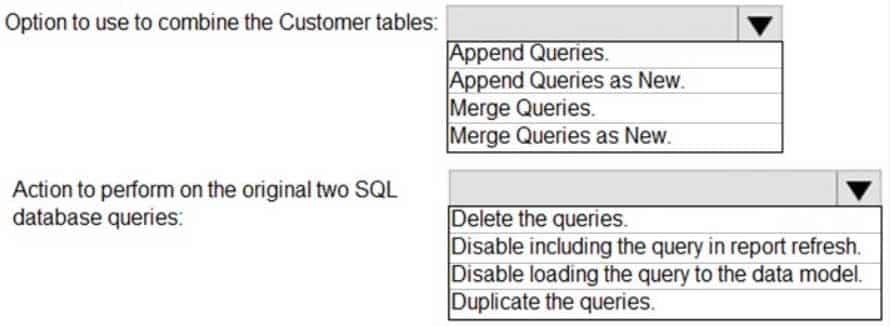
DA-100 Analyzing Data with Microsoft Power BI Part 02 Q11 027 Question 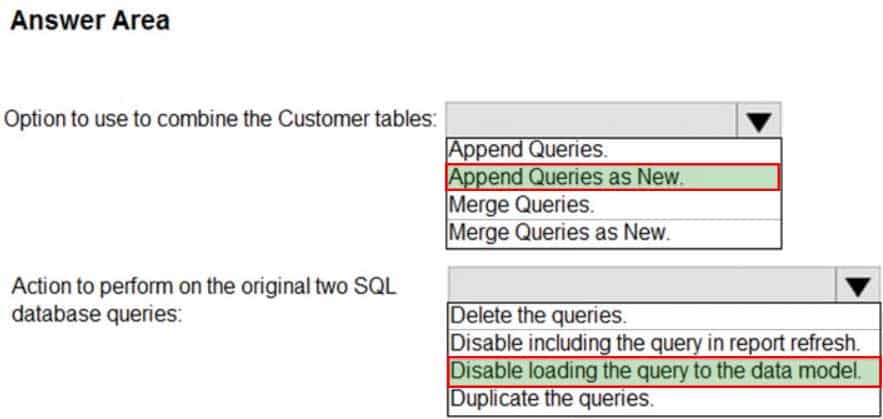
DA-100 Analyzing Data with Microsoft Power BI Part 02 Q11 027 Answer Explanation:Box 1: Append Queries as New.
There are two primary ways of combining queries: merging and appending.
– When you have one or more columns that you’d like to add to another query, you merge the queries.
– When you have additional rows of data that you’d like to add to an existing query, you append the query.Box 2: Disable loading the query to the data model
For every query that loads into model memory will be consumed. and Memory is our asset in the Model, less memory consumption leads to better performance in most of the cases. The best approach is to disable loading. -
HOTSPOT
You have a folder of monthly transaction extracts.
You plan to create a report to analyze the transaction data.
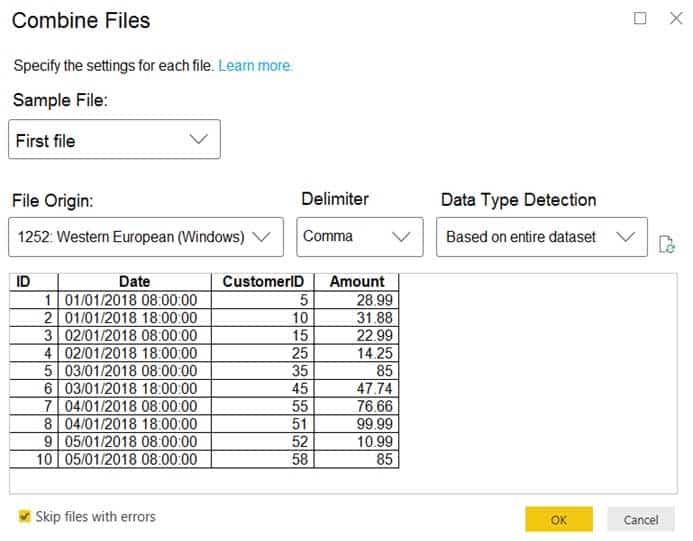
You receive the following email message: “Hi, I’ve put 24 files of monthly transaction data onto the shared drive. File Transactions201801.csv through Transaction201812.csv have four columns while files Transactions201901.csv through Transaction201912.csv have the same four columns plus an additional three columns. Each file contains 10 to 50 transactions.”
You get data from the folder and select Combine & Load. The Combine Files dialog box is shown in the exhibit. (Click the Exhibit tab.)
DA-100 Analyzing Data with Microsoft Power BI Part 02 Q12 028 For each of the following statements, select Yes if the statement is true. Otherwise, select No.
NOTE: Each correct selection is worth one point.

DA-100 Analyzing Data with Microsoft Power BI Part 02 Q12 029 Question 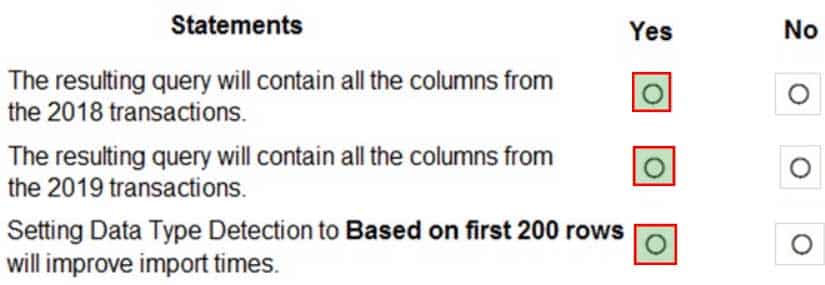
DA-100 Analyzing Data with Microsoft Power BI Part 02 Q12 029 Answer Explanation:Box 1: Yes
The four columns used in the 2018 transactions are already displayed.Box 2: Yes
The columns used are based on the entire dataset. The additional columns in the 2019 files will be detected.Box 3: Yes
Note: Under the hoods, Power BI will automatically detect which delimiter to use, and may even promote the first row as headers. You can manually change the delimiter, or define how Power BI should handle data types. You can set it to automatically detect data types based on first 200 rows, or the entire dataset or you can even opt out the detection of data types.
-
DRAG DROP
You receive revenue data that must be included in Microsoft Power BI reports.
You preview the data from a Microsoft Excel source in Power Query as shown in the following exhibit.

DA-100 Analyzing Data with Microsoft Power BI Part 02 Q13 030 You plan to create several visuals from the data, including a visual that shows revenue split by year and product.
You need to transform the data to ensure that you can build the visuals. The solution must ensure that the columns are named appropriately for the data that they contain.
Which three actions should you perform in sequence? To answer, move the appropriate actions from the list of actions to the answer area and arrange them in the correct order.

DA-100 Analyzing Data with Microsoft Power BI Part 02 Q13 031 Question 
DA-100 Analyzing Data with Microsoft Power BI Part 02 Q13 031 Answer Explanation:Step 1: Select Use Header as First Row.
Step 2: Select Department and Product and Unpivot Other Columns
Unpivot Other Columns: This command unpivots unselected columns. Use this command in a query when not all columns are known. New columns added during a refresh operation are also unpivoted.Step 3: Rename the Attribute column to Year and the Value column to Revenue.
You might want to unpivot data, sometimes called flattening the data, to put it in a matrix format so that all similar values are in one column. This is necessary, for example, to create a chart or a report.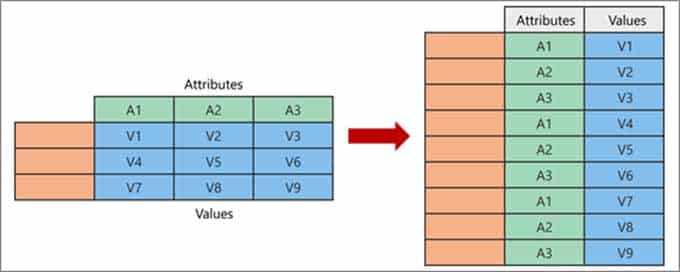
DA-100 Analyzing Data with Microsoft Power BI Part 02 Q13 032 When you unpivot, you unpack the attribute-value pairs that represent an intersection point of the new columns and re-orient them into flattened columns:
Values (in blue on the left) are unpivoted into a new column (in blue on the right).
Attributes (in green on the left) are unpivoted into a new column (in green on the right) and duplicates are correspondingly mapped to the new Values column.
-
HOTSPOT
You are building a financial report by using Power BI.
You have a table named financials that contains a column named Date and a column named Sales.
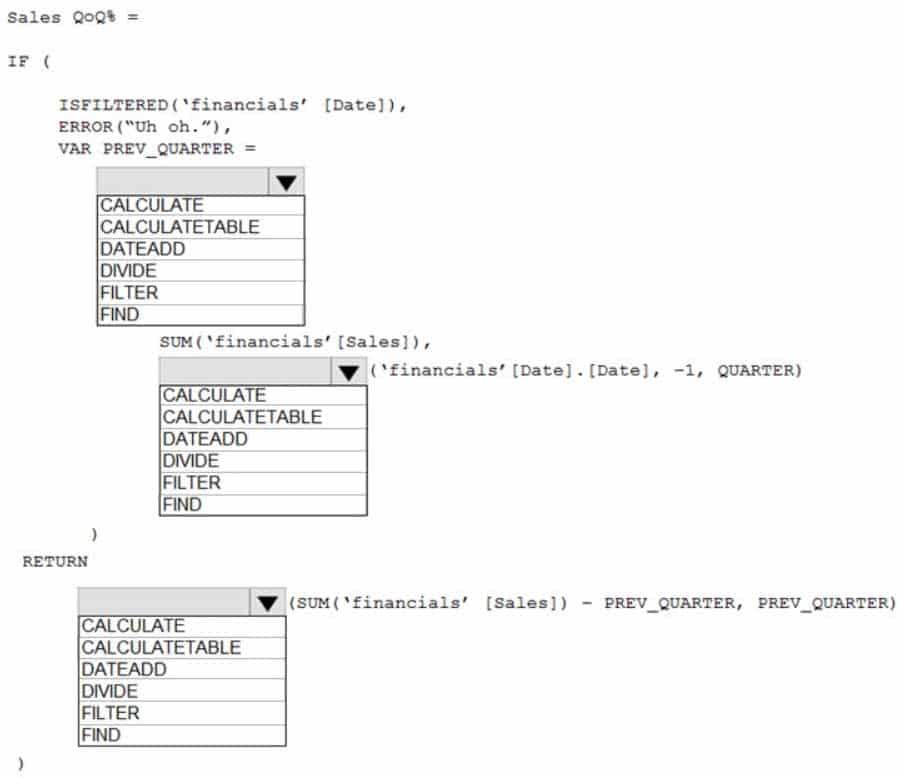
You need to create a measure that calculates the relative change in sales as compared to the previous quarter.
How should you complete the measure? To answer, select the appropriate options in the answer area.
NOTE: Each correct selection is worth one point.
DA-100 Analyzing Data with Microsoft Power BI Part 02 Q14 033 Question 
DA-100 Analyzing Data with Microsoft Power BI Part 02 Q14 033 Answer Explanation:Box 1: CALCULATE
Box 2: DATEADD
Box 3: DIVIDE
Example:
NET_SALES QoQ% =
IF(
ISFILTERED(‘Calendar'[Date]),
ERROR(“Time intelligence quick measures can only be grouped or filtered by the Power BI-provided date hierarchy or primary date column.”),
VAR __PREV_QUARTER =
CALCULATE(
SUM(‘research ra_qtr_template'[NET_SALES]),
DATEADD(‘Calendar'[Date].[Date], -1, QUARTER)
)
RETURN
DIVIDE(
SUM(‘research ra_qtr_template'[NET_SALES]) – __PREV_QUARTER,
__PREV_QUARTER
)
) -
You have a custom connector that returns ID, From, To, Subject, Body, and Has Attachments for every email sent during the past year. More than 10 million records are returned.
You build a report analyzing the internal networks of employees based on whom they send emails to.
You need to prevent report recipients from reading the analyzed emails. The solution must minimize the model size.
What should you do?
- Implement row-level security (RLS) so that the report recipients can only see results based on the emails they sent.
- Remove the Subject and Body columns during the import.
- From Model view, set the Subject and Body columns to Hidden.
Explanation:Incorrect Answers:
A, C: Does not reduce the size of the model. -
Your company has training videos that are published to YouTube.
You need to surface the videos directly in a Microsoft Power BI dashboard.
Which type of tile should you add?
- video
- custom streaming data
- text box
- web content
Explanation: The only way to visualize a streaming dataset is to add a tile and use the streaming dataset as a custom streaming data source. -
Case Study
This is a case study. Case studies are not timed separately. You can use as much exam time as you would like to complete each case. However, there may be additional case studies and sections on this exam. You must manage your time to ensure that you are able to complete all questions included on this exam in the time provided.
To answer the questions included in a case study, you will need to reference information that is provided in the case study. Case studies might contain exhibits and other resources that provide more information about the scenario that is described in the case study. Each question is independent of the other question on this case study.
At the end of this case study, a review screen will appear. This screen allows you to review your answers and to make changes before you move to the next section of the exam. After you begin a new section, you cannot return to this section.
To start the case study
To display the first question on this case study, click the Next button. Use the buttons in the left pane to explore the content of the case study before you answer the questions. Clicking these buttons displays information such as business requirements, existing environment, and problem statements. If the case study has an All Information tab, note that the information displayed is identical to the information displayed on the subsequent tabs. When you are ready to answer a question, click the Question button to return to the question.Overview
Litware, Inc. is an online retailer that uses Microsoft Power BI dashboards and reports.
The company plans to leverage data from Microsoft SQL Server databases, Microsoft Excel files, text files, and several other data sources.
Litware uses Azure Active Directory (Azure AD) to authenticate users.
Existing Environment
Sales Data
Litware has online sales data that has the SQL schema shown in the following table.
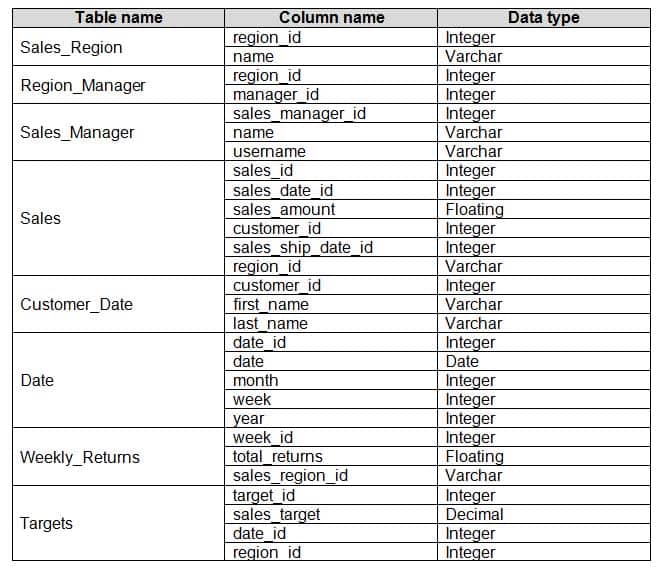
DA-100 Analyzing Data with Microsoft Power BI Part 02 Q17 034 In the Date table, the date_id column has a format of yyyymmdd and the month column has a format of yyyymm.
The week column in the Date table and the week_id column in the Weekly_Returns table have a format of yyyyww.
The sales_id column in the Sales table represents a unique transaction.
The region_id column can be managed by only one sales manager.
Data Concerns
You are concerned with the quality and completeness of the sales data. You plan to verify the sales data for negative sales amounts.
Reporting Requirements
Litware identifies the following technical requirements:
– Executives require a visual that shows sales by region.
– Regional managers require a visual to analyze weekly sales and returns.
– Sales managers must be able to see the sales data of their respective region only.
– The sales managers require a visual to analyze sales performance versus sales targets.
– The sale department requires reports that contain the number of sales transactions.
– Users must be able to see the month in reports as shown in the following example: Feb 2020.
– The customer service department requires a visual that can be filtered by both sales month and ship month independently.-
You need to create the required relationship for the executive’s visual.
What should you do before you can create the relationship?
- Change the data type of Sales[region_id] to Whole Number.
- Change the data type of Sales[region_id] to Decimal Number.
- Change the data type of Sales[sales_id] to Text.
- In the Sales table, add a measure for Sum(sales_amount).
Explanation:Scenario: Executives require a visual that shows sales by region.
Need to change the sales_id column from Varchar to Whole Number (Integer).
-
What should you create to meet the reporting requirements of the sales department?
- a measure that uses a formula of SUM(Sales[sales_id])
- a calculated column that use a formula of COUNTA(Sales[sales_id])
- a measure that uses a formula of COUNTROWS(Sales)
- a calculated column that uses a formula of SUM(Sales[sales_id])
Explanation:The sale department requires reports that contain the number of sales transactions.
The COUNTROWS function counts the number of rows in the specified table, or in a table defined by an expression.
Incorrect Answers:
B: COUNTA counts the number of values in a column. It returns the number of cells in a column that contain a non blank value. -
You need to provide a solution to provide the sales managers with the required access.
What should you include in the solution?
- Create a security role that has a table filter on the Sales_Manager table where
username = UserName(). - Create a security role that has a table filter on the Region_Manager table where
sales_manager_id = UserPrincipalName(). - Create a security role that has a table filter on the Sales_Manager table where
name = UserName(). - Create a security role that has a table filter on the Sales_Manager table where
username = sales_manager_id.
Explanation:Scenario: The region_id column can be managed by only one sales manager.
You can use Username() or userprincipalname() in DAX with Row-Level Security.
Within Power BI Desktop, username() will return a user in the format of DOMAIN\User and userprincipalname() will return a user in the format of [email protected].Incorrect Answers:
B: sales_manager_id is an integer and cannot be converted to a string datatype. - Create a security role that has a table filter on the Sales_Manager table where
-
You need to create a relationship between the Weekly_Returns table and the Date table to meet the reporting requirements of the regional managers.
What should you do?
- Add the Weekly_Returns data to the Sales table by using RELATED DAX functions.
- In the Weekly_Returns table, create a new calculated column named date_id in a format of yyyymmdd and use the calculated column to create a relationship to the Date table.
- Create a new table based on the Date table where date_id is unique, and then create a many-to-many relationship to Weekly_Return.
Explanation:Scenario: Regional managers require a visual to analyze weekly sales and returns.
To relate the two tables we need a common column.
-
You need to create relationships to meet the reporting requirements of the customer service department.
What should you create?
- an additional date table named ShipDate, a one-to-many relationship from Date[date_id] to Sales[Sales_date_id], and a one-to-many relationship from ShipDate[date_id] to Sales[sales_ship_date_id]
- an additional date table named ShipDate, a many-to-many relationship from Sales[sales_date_id] to Date[date_id], and a many-to-many relationship from Sales[sales_ship_date_id] to ShipDate[date_id]
- a one-to-many relationship from Date[date_id] to Sales[sales_date_id] and another one-to-many relationship from Date[date_id] to Weekly_Returns[week_id]
- a one-to-many relationship from Sales[sales_date_id] to Date[date_id] and a one-to-many relationship from Sales[sales_ship_date_id] to Date[date_id]
Explanation:Scenario: The customer service department requires a visual that can be filtered by both sales month and ship month independently.
In Power BI Desktop, only one relationship can be active between a Fact table and Dimension table, so we need an extra table.
Use one-to-many relationship to be able to filter.
Incorrect Answers:
C: Cannot make a relation between a date_id and a week_id.D: The one-to-many relationships between the Sales and the Date tables goes in the other direction: for each date there can be many sales or shipments.
-
-
Case Study
This is a case study. Case studies are not timed separately. You can use as much exam time as you would like to complete each case. However, there may be additional case studies and sections on this exam. You must manage your time to ensure that you are able to complete all questions included on this exam in the time provided.
To answer the questions included in a case study, you will need to reference information that is provided in the case study. Case studies might contain exhibits and other resources that provide more information about the scenario that is described in the case study. Each question is independent of the other question on this case study.
At the end of this case study, a review screen will appear. This screen allows you to review your answers and to make changes before you move to the next section of the exam. After you begin a new section, you cannot return to this section.
To start the case study
To display the first question on this case study, click the Next button. Use the buttons in the left pane to explore the content of the case study before you answer the questions. Clicking these buttons displays information such as business requirements, existing environment, and problem statements. If the case study has an All Information tab, note that the information displayed is identical to the information displayed on the subsequent tabs. When you are ready to answer a question, click the Question button to return to the question.Overview
Contoso, Ltd. is a manufacturing company that produces outdoor equipment. Contoso has quarterly board meetings for which financial analysts manually prepare Microsoft Excel reports, including profit and loss statements for each of the company’s four business units, a company balance sheet, and net income projections for the next quarter.
Existing Environment
Data and Sources
Data for the reports comes from three sources. Detailed revenue, cost, and expense data comes from an Azure SQL database. Summary balance sheet data comes from Microsoft Dynamics 365 Business Central. The balance sheet data is not related to the profit and loss results, other than they both relate to dates.
Monthly revenue and expense projections for the next quarter come from a Microsoft SharePoint Online list. Quarterly projections relate to the profit and loss results by using the following shared dimensions: date, business unit, department, and product category.
Net Income Projection Data
Net income projection data is stored in a SharePoint Online list named Projections in the format shown in the following table.
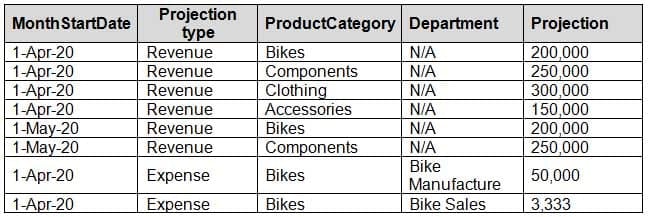
DA-100 Analyzing Data with Microsoft Power BI Part 02 Q18 035 Revenue projections are set at the monthly level and summed to show projections for the quarter.
Balance Sheet Data
The balance sheet data is imported with final balances for each account per month in the format shown in the following table.
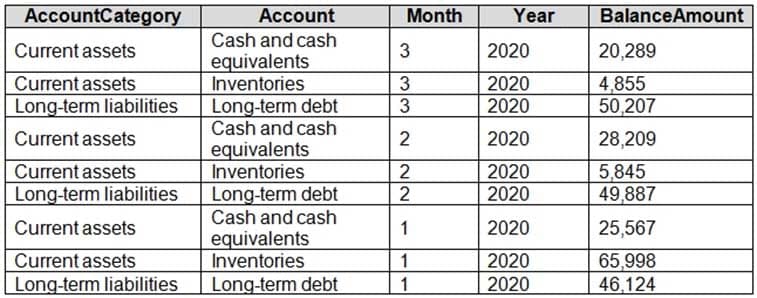
DA-100 Analyzing Data with Microsoft Power BI Part 02 Q18 036 There is always a row for each account for each month in the balance sheet data.
Dynamics 365 Business Central Data
Business Central contains a product catalog that shows how products roll up to product categories, which roll up to business units.
Revenue data is provided at the date and product level. Expense data is provided at the date and department level.
Business Issues
Historically, it has taken two analysts a week to prepare the reports for the quarterly board meetings. Also, there is usually at least one issue each quarter where a value in a report is wrong because of a bad cell reference in an Excel formula. On occasion, there are conflicting results in the reports because the products and departments that roll up to each business unit are not defined consistently.
Requirements
Planned Changes
Contoso plans to automate and standardize the quarterly reporting process by using Microsoft Power BI. The company wants to how long it takes to populate reports to less than two days. The company wants to create common logic for business units, products, and departments to be used across all reports, including, but not limited, to the quarterly reporting for the board.
Technical Requirements
Contoso wants the reports and datasets refreshed with minimal manual effort.
The company wants to provide a single package of reports to the board that contains custom navigation and links to supplementary information.
Maintenance, including manually updating data and access, must be minimized as much as possible.
Security Requirements
The reports must be made available to the board from powerbi.com. An Azure Active Directory group will be used to share information with the board.
The analysts responsible for each business unit must see all the data the board sees, except the profit and loss data, which must be restricted to only their business unit’s data. The analysts must be able to build new reports from the dataset that contains the profit and loss data, but any reports that the analysts build must not be included in the quarterly reports for the board. The analysts must not be able to share the quarterly reports with anyone.
Report Requirements
You plan to relate the balance sheet to a standard date table in Power BI in a many-to-one relationship based on the last day of the month. At least one of the balance sheet reports in the quarterly reporting package must show the ending balances for the quarter, as well as for the previous quarter.
Projections must contain a column named Revenue Projection that contains the revenue projection amounts. A relationship must be created from Projections to a table named Date that contains the columns shown in the following table.

DA-100 Analyzing Data with Microsoft Power BI Part 02 Q18 037 The definitions and attributes of products, departments, and business units must be consistent across all reports.
The board must be able to get the following information from the quarterly reports:
– Revenue trends over time
– Ending balances for each account
– A comparison of expenses versus projections by quarter
– Changes in long-term liabilities from the previous quarter
– A comparison of quarterly revenue versus the same quarter during the prior year-
DRAG DROP
Once the profit and loss dataset is created, which four actions should you perform in sequence to ensure that the business unit analysts see the appropriate profit and loss data? To answer, move the appropriate actions from the list of actions to the answer area and arrange them in the correct order.
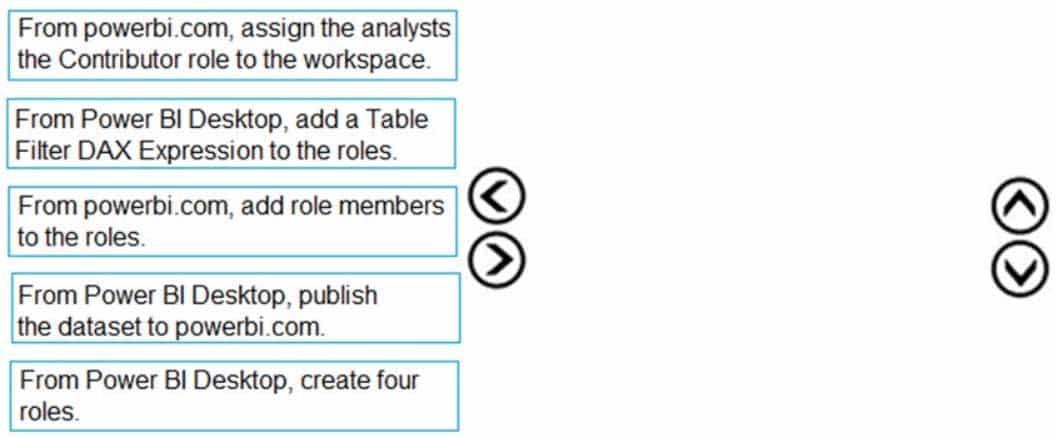
DA-100 Analyzing Data with Microsoft Power BI Part 02 Q18 038 Question 
DA-100 Analyzing Data with Microsoft Power BI Part 02 Q18 038 Answer Explanation:Scenario: The analysts responsible for each business unit must see all the data the board sees, except the profit and loss data, which must be restricted to only their business unit’s data. The analysts must be able to build new reports from the dataset that contains the profit and loss data, but any reports that the analysts build must not be included in the quarterly reports for the board. The analysts must not be able to share the quarterly reports with anyone.
Define roles and rules in Power BI Desktop
You can define roles and rules within Power BI Desktop. When you publish to Power BI, it also publishes the role definitions.To define security roles, follow these steps.
1. Import data into your Power BI Desktop report, or configure a Direct Query connection.
(step 1: From Power BI Desktop, publish the dataset to powerbi.com)
2. From the Modeling tab, select Manage Roles.
3. From the Manage roles window, select Create.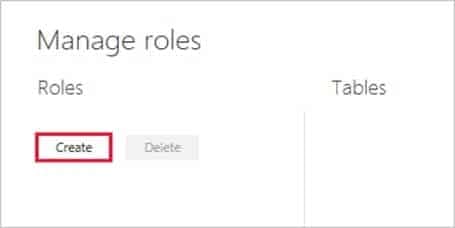
DA-100 Analyzing Data with Microsoft Power BI Part 02 Q18 039 (Step 2: From Power BI Desktop, create four roles.)
4. Under Roles, provide a name for the role.
5. Under Tables, select the table to which you want to apply a DAX rule.
6. In the Table filter DAX expression box, enter the DAX expressions. This expression returns a value of true or false. For example: [Entity ID] = “Value”.
(Step 3: From Power BI Desktop, add Table Filter DAX Expression to the roles.)
7. After you’ve created the DAX expression, select the checkmark above the expression box to validate the expression.
DA-100 Analyzing Data with Microsoft Power BI Part 02 Q18 040 8. Select Save.
Step 4: From powerbi.com, add role members to the roles.
You can’t assign users to a role within Power BI Desktop. You assign them in the Power BI service. -
Which DAX expression should you use to get the ending balances in the balance sheet reports?
-
CALCULATE (

SUM( BalanceSheet [BalanceAmount] ),

DATESQTD( 'Date'[Date] )

)
-
CALCULATE ( SUM( BalanceSheet [BalanceAmount] ), LASTDATE( 'Date'[Date] ) ) -
FIRSTNONBLANK ( 'Date' [Date]

SUM( BalanceSheet[BalanceAmount] )

)
-
CALCULATE (

MAX( BalanceSheet[BalanceAmount] ),

LASTDATE( 'Date' [Date] )

)
Explanation:Scenario: At least one of the balance sheet reports in the quarterly reporting package must show the ending balances for the quarter, as well as for the previous quarter.
Semi-additive calculations, such as balance at end of month, use LASTDATE Functions.
-
-
HOTSPOT
You need to calculate the last day of the month in the balance sheet data to ensure that you can relate the balance sheet data to the Date table.
Which type of calculation and which formula should you use? To answer, select the appropriate options in the answer area.
NOTE: Each correct selection is worth one point.

DA-100 Analyzing Data with Microsoft Power BI Part 02 Q18 041 Question 
DA-100 Analyzing Data with Microsoft Power BI Part 02 Q18 041 Answer Explanation:Box 1: An M custom column
Box 2: Date.EndOfMonth(#date([Year],[Month],1))
-
-
Case study
This is a case study. Case studies are not timed separately. You can use as much exam time as you would like to complete each case. However, there may be additional case studies and sections on this exam. You must manage your time to ensure that you are able to complete all question included on this exam in the time provided.
To answer the questions included in a case study, you will need to reference information that is provided in the case study. Case studies might contain exhibits and other resources that provide more information about the scenario that is described in the case study. Each question is independent of the other question on this case study.
At the end of this case study, a review screen will appear. This screen allows you to review your answers and to make changes before you move to the next section of the exam. After you begin a new section, you cannot return to this section.
To start the case study
To display the first question on this case study, click the Next button. Use the buttons in the left pane to explore the content of the case study before you answer the questions. Clicking these buttons displays information such as business requirements, existing environment, and problem statements. If the case study has an All Information tab, note that the information displayed is identical to the information displayed on the subsequent tabs. When you are ready to answer a question, click the Question button to return to the question.Overview. General Overview
Northwind Traders is a specialty food import company.
The company recently implemented Power BI to better understand its top customers, products, and suppliers.
Overview. Business Issues
The sales department relies on the IT department to generate reports in Microsoft SQL Server Reporting Services (SSRS). The IT department takes too long to generate the reports and often misunderstands the report requirements.
Existing Environment. Data Sources
Northwind Traders uses the data sources shown in the following table.

DA-100 Analyzing Data with Microsoft Power BI Part 02 Q19 042 Source2 is exported daily from a third-party system and stored in Microsoft SharePoint Online.
Existing Environment. Customer Worksheet
Source2 contains a single worksheet named Customer Details. The first 11 rows of the worksheet are shown in the following table.

DA-100 Analyzing Data with Microsoft Power BI Part 02 Q19 043 All the fields in Source2 are mandatory.
The Address column in Customer Details is the billing address, which can differ from the shipping address.
Existing Environment. Azure SQL Database
Source1 contains the following table:
– Orders
– Products
– Suppliers
– Categories
– Order Details
– Sales EmployeesThe Orders table contains the following columns.
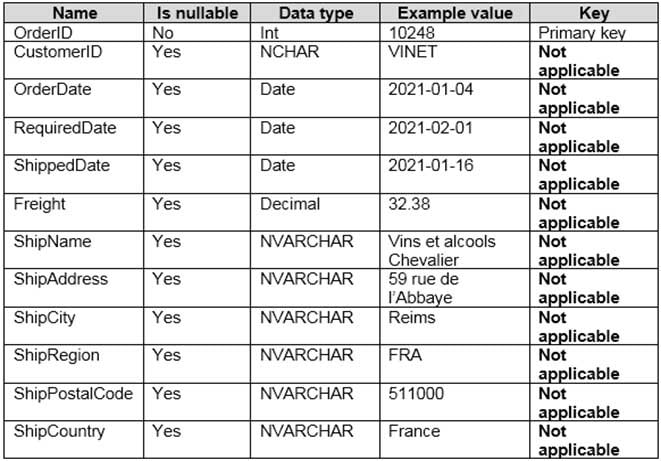
DA-100 Analyzing Data with Microsoft Power BI Part 02 Q19 044 The Order Details table contains the following columns.
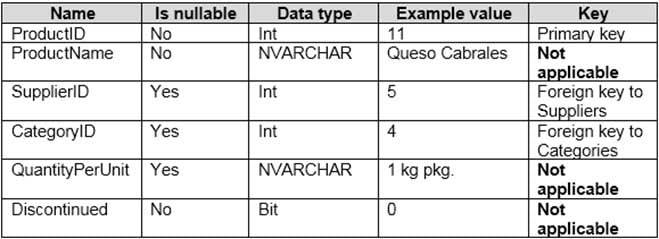
DA-100 Analyzing Data with Microsoft Power BI Part 02 Q19 045 The address in the Orders table is the shipping address, which can differ from the billing address.
The Products table contains the following columns.

DA-100 Analyzing Data with Microsoft Power BI Part 02 Q19 046 The Categories table contains the following columns.

DA-100 Analyzing Data with Microsoft Power BI Part 02 Q19 047 The Suppliers table contains the following columns.

DA-100 Anaalyzing Data with Microsoft Power BI Part 02 Q19 048 The Sales Employees table contains the following columns.
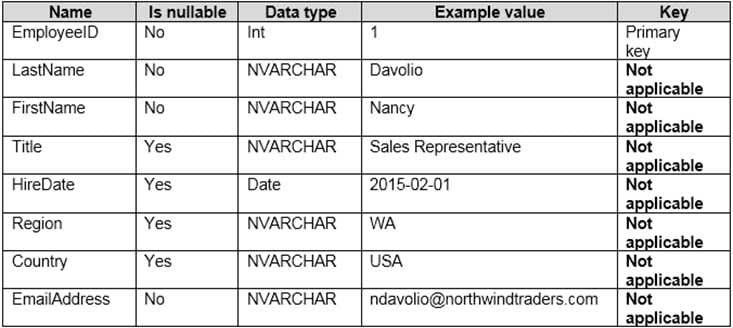
DA-100 Analyzing Data with Microsoft Power BI Part 02 Q19 049 Each employee in the Sales Employees table is assigned to one sales region. Multiple employees can be assigned to each region.
Requirements. Report Requirements
Northwind Traders requires the following reports:
– Top Products
– Top Customers
– On-Time ShippingThe Top Customers report will show the top 20 customers based on the highest sales amounts in a selected order month or quarter, product category, and sales region.
The Top Products report will show the top 20 products based on the highest sales amounts sold in a selected order month or quarter, sales region, and product category. The report must also show which suppliers provide the top products.
The On-Time Shipping report will show the following metrics for a selected shipping month or quarter:
– The percentage of orders that were shipped late by country and shipping region
– Customers that had multiple late shipments during the last quarterNorthwind Traders defines late orders as those shipped after the required shipping date.
The warehouse shipping department must be notified if the percentage of late orders within the current month exceeds 5%.
The reports must show historical data for the current calendar year and the last three calendar years.
Requirements. Technical Requirements
Northwind Traders identifies the following technical requirements:
– A single dataset must support all three reports.
– The reports must be stored in a single Power BI workspace.
– Report data must be current as of 7 AM Pacific Time each day.
– The reports must provide fast response times when users interact with a visualization.
– The data model must minimize the size of the dataset as much as possible, while meeting the report requirements and the technical requirements.Requirements. Security Requirements
Access to the reports must be granted to Azure Active Directory (Azure AD) security groups only. An Azure AD security group exists for each department.
The sales department must be able to perform the following tasks in Power BI:
– Create, edit, and delete content in the reports.
– Manage permissions for workspaces, datasets, and report.
– Publish, unpublish, update, and change the permissions for an app.
– Assign Azure AD groups role-based access to the reports workspace.Users in the sales department must be able to access only the data of the sales region to which they are assigned in the Sales Employees table.
Power BI has the following row-level security (RLS) Table filter DAX expression for the Sales Employees table.
[EmailAddress] = USERNAME()
RLS will be applied only to the sales department users. Users in all other departments must be able to view all the data.
-
HOTSPOT
You need to create a measure that will return the percentage of late orders.
How should you complete the DAX expression? To answer, select the appropriate options in the answer area.
NOTE: Each correct selection is worth one point.

DA-100 Analyzing Data with Microsoft Power BI Part 02 Q19 050 Question 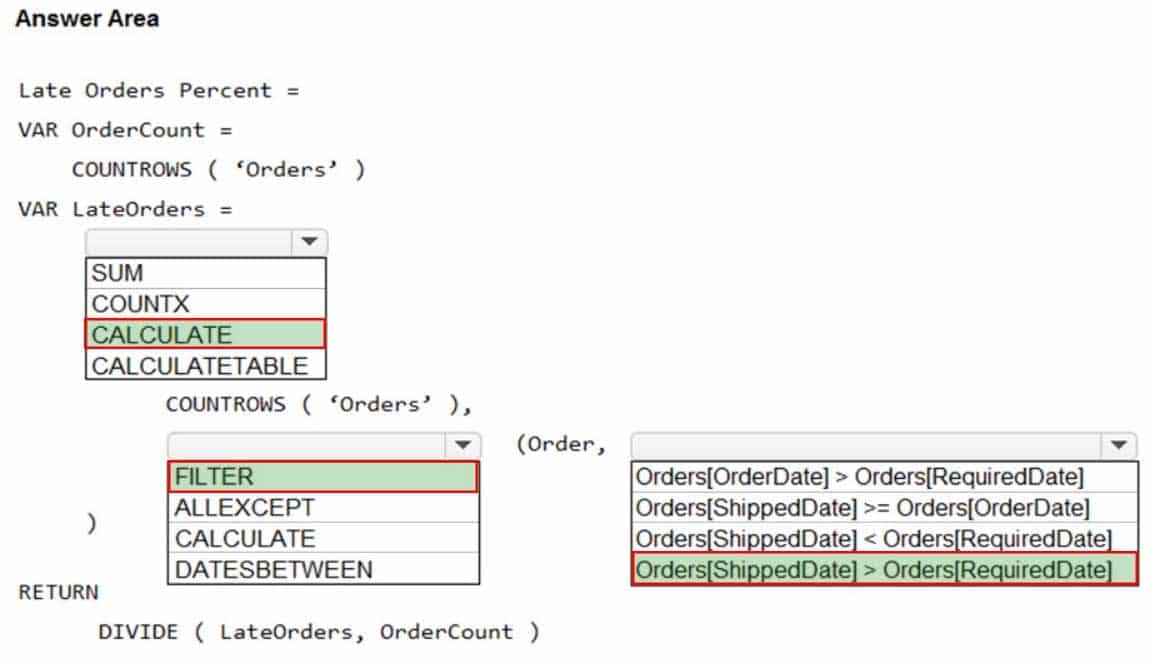
DA-100 Analyzing Data with Microsoft Power BI Part 02 Q19 050 Answer Explanation:Box 1: CALCULATE
CALCULATE evaluates an expression in a modified filter context.Syntax: CALCULATE(<expression>[, <filter1> [, <filter2> [, …]]])
Expression – The expression to be evaluated.
filter1, filter2,… (Optional) Boolean expressions or table expressions that defines filters, or filter modifier functions.Box 2: FILTER
FILTER returns a table that represents a subset of another table or expression.
Syntax: FILTER(<table>,<filter>)
Table- The table to be filtered. The table can also be an expression that results in a table.
Filter – A Boolean expression that is to be evaluated for each row of the table. For example, [Amount] > 0 or [Region] = “France”Box 3: Orders[ShippedDate]> Orders[RequiredDate]
Northwind Traders defines late orders as those shipped after the required shipping date. -
HOTSPOT
You need to create a relationship in the dataset for RLS.
What should you do? To answer, select the appropriate options in the answer area.
NOTE: Each correct selection is worth one point.

DA-100 Analyzing Data with Microsoft Power BI Part 02 Q19 051 Question 
DA-100 Analyzing Data with Microsoft Power BI Part 02 Q19 051 Answer Explanation:Box 1: many-to-one
Each employee in the Sales Employees table is assigned to one sales region. Multiple employees can be assigned to each region.The Suppliers table has a Region column.
Box 2: Suppliers table
-
-
You build a report to analyze customer transactions from a database that contains the tables shown in the following table.
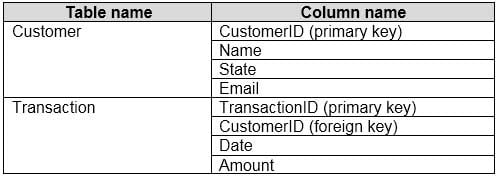
DA-100 Analyzing Data with Microsoft Power BI Part 02 Q20 052 You import the tables.
Which relationship should you use to link the tables?
- many-to-many between Customer and Transaction
- one-to-many from Transaction to Customer
- one-to-many from Customer to Transaction
- one-to-one between Customer and Transaction
Explanation:
Each customer can have many transactions.
For each transaction there is exactly one customer.