DA-100 : Analyzing Data with Microsoft Power BI : Part 06
-
Case Study
This is a case study. Case studies are not timed separately. You can use as much exam time as you would like to complete each case. However, there may be additional case studies and sections on this exam. You must manage your time to ensure that you are able to complete all questions included on this exam in the time provided.
To answer the questions included in a case study, you will need to reference information that is provided in the case study. Case studies might contain exhibits and other resources that provide more information about the scenario that is described in the case study. Each question is independent of the other question on this case study.
At the end of this case study, a review screen will appear. This screen allows you to review your answers and to make changes before you move to the next section of the exam. After you begin a new section, you cannot return to this section.
To start the case study
To display the first question on this case study, click the Next button. Use the buttons in the left pane to explore the content of the case study before you answer the questions. Clicking these buttons displays information such as business requirements, existing environment, and problem statements. If the case study has an All Information tab, note that the information displayed is identical to the information displayed on the subsequent tabs. When you are ready to answer a question, click the Question button to return to the question.Overview
Contoso, Ltd. is a manufacturing company that produces outdoor equipment. Contoso has quarterly board meetings for which financial analysts manually prepare Microsoft Excel reports, including profit and loss statements for each of the company’s four business units, a company balance sheet, and net income projections for the next quarter.
Existing Environment
Data and Sources
Data for the reports comes from three sources. Detailed revenue, cost, and expense data comes from an Azure SQL database. Summary balance sheet data comes from Microsoft Dynamics 365 Business Central. The balance sheet data is not related to the profit and loss results, other than they both relate to dates.
Monthly revenue and expense projections for the next quarter come from a Microsoft SharePoint Online list. Quarterly projections relate to the profit and loss results by using the following shared dimensions: date, business unit, department, and product category.
Net Income Projection Data
Net income projection data is stored in a SharePoint Online list named Projections in the format shown in the following table.

DA-100 Analyzing Data with Microsoft Power BI Part 06 Q01 132 Revenue projections are set at the monthly level and summed to show projections for the quarter.
Balance Sheet Data
The balance sheet data is imported with final balances for each account per month in the format shown in the following table.
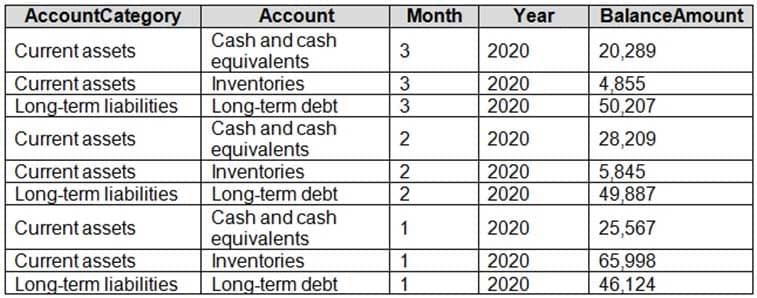
DA-100 Analyzing Data with Microsoft Power BI Part 06 Q01 133 There is always a row for each account for each month in the balance sheet data.
Dynamics 365 Business Central Data
Business Central contains a product catalog that shows how products roll up to product categories, which roll up to business units.
Revenue data is provided at the date and product level. Expense data is provided at the date and department level.
Business Issues
Historically, it has taken two analysts a week to prepare the reports for the quarterly board meetings. Also, there is usually at least one issue each quarter where a value in a report is wrong because of a bad cell reference in an Excel formula. On occasion, there are conflicting results in the reports because the products and departments that roll up to each business unit are not defined consistently.
Requirements
Planned Changes
Contoso plans to automate and standardize the quarterly reporting process by using Microsoft Power BI. The company wants to how long it takes to populate reports to less than two days. The company wants to create common logic for business units, products, and departments to be used across all reports, including, but not limited, to the quarterly reporting for the board.
Technical Requirements
Contoso wants the reports and datasets refreshed with minimal manual effort.
The company wants to provide a single package of reports to the board that contains custom navigation and links to supplementary information.
Maintenance, including manually updating data and access, must be minimized as much as possible.
Security Requirements
The reports must be made available to the board from powerbi.com. An Azure Active Directory group will be used to share information with the board.
The analysts responsible for each business unit must see all the data the board sees, except the profit and loss data, which must be restricted to only their business unit’s data. The analysts must be able to build new reports from the dataset that contains the profit and loss data, but any reports that the analysts build must not be included in the quarterly reports for the board. The analysts must not be able to share the quarterly reports with anyone.
Report Requirements
You plan to relate the balance sheet to a standard date table in Power BI in a many-to-one relationship based on the last day of the month. At least one of the balance sheet reports in the quarterly reporting package must show the ending balances for the quarter, as well as for the previous quarter.
Projections must contain a column named RevenueProjection that contains the revenue projection amounts. A relationship must be created from Projections to a table named Date that contains the columns shown in the following table.

DA-100 Analyzing Data with Microsoft Power BI Part 06 Q01 134 The definitions and attributes of products, departments, and business units must be consistent across all reports.
The board must be able to get the following information from the quarterly reports:
– Revenue trends over time
– Ending balances for each account
– A comparison of expenses versus projections by quarter
– Changes in long-term liabilities from the previous quarter
– A comparison of quarterly revenue versus the same quarter during the prior year-
HOTSPOT
How should you distribute the reports to the board? To answer, select the appropriate options in the answer area.
NOTE: Each correct selection is worth one point.
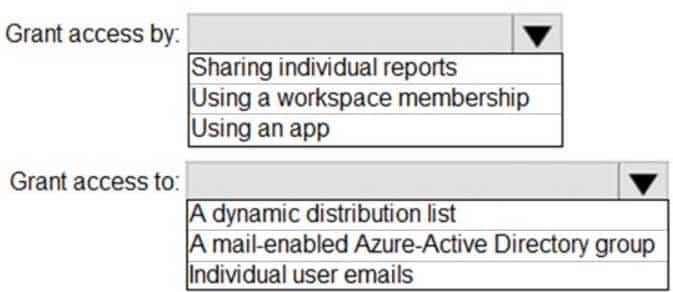
DA-100 Analyzing Data with Microsoft Power BI Part 06 Q01 135 Question 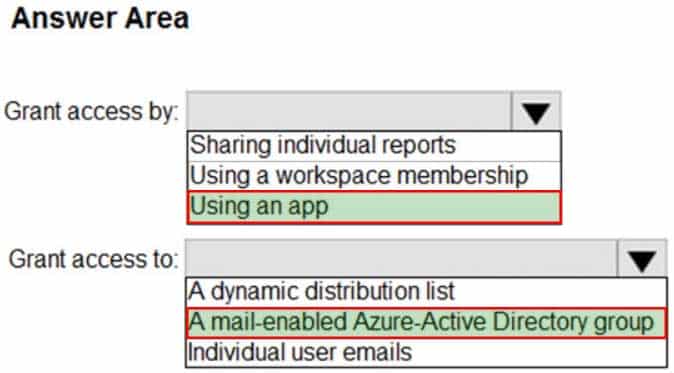
DA-100 Analyzing Data with Microsoft Power BI Part 06 Q01 135 Answer Explanation:Box 1: Using an app
Scenario:
The company wants to provide a single package of reports to the board that contains custom navigation and links to supplementary information.Box 2: A mail-enabled Azure-Active Directory group
Scenario: Security Requirements
The reports must be made available to the board from powerbi.com. A mail-enabled Azure-Active Directory (security)group will be used to share information with the board. -
HOTSPOT
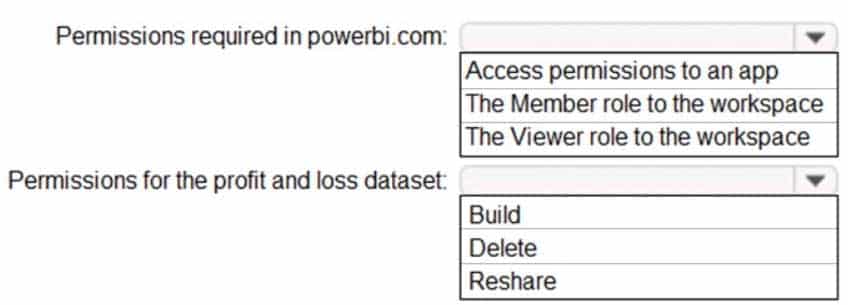
You need to grant access to the business unit analysts.
What should you configure? To answer, select the appropriate options in the answer area.
NOTE: Each correct selection is worth one point.
DA-100 Analyzing Data with Microsoft Power BI Part 06 Q01 136 Question 
DA-100 Analyzing Data with Microsoft Power BI Part 06 Q01 136 Answer Explanation:Box 1: The Viewer role to the workspace
The Viewer role gives a read-only experience to its users. They can view dashboards, reports, or workbooks in the workspace, but can’t browse the datasets or dataflows. Use the Viewer role wherever you would previously use a classic workspace set to “Members can only view Power BI content”.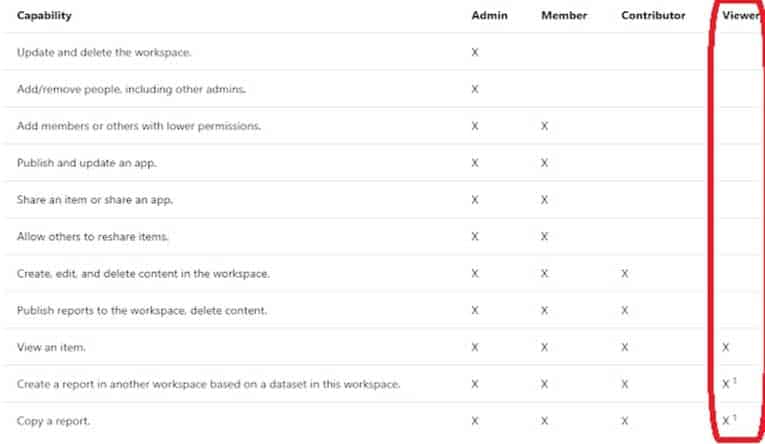
DA-100 Analyzing Data with Microsoft Power BI Part 06 Q01 137 Box 2: Build
The analysts must be able to build new reports from the dataset that contains the profit and loss data.Scenario: The reports must be made available to the board from powerbi.com.
The analysts responsible for each business unit must see all the data the board sees, except the profit and loss data, which must be restricted to only their business unit’s data. The analysts must be able to build new reports from the dataset that contains the profit and loss data, but any reports that the analysts build must not be included in the quarterly reports for the board. The analysts must not be able to share the quarterly reports with anyone.
-
-
DRAG DROP
You have a Microsoft Power BI workspace.
You need to grant the user capabilities shown in the following table.

DA-100 Analyzing Data with Microsoft Power BI Part 06 Q02 138 The solution must use the principle of least privilege.
Which user role should you assign to each user? To answer, drag the appropriate roles to the correct users. Each role may be used once, more than once, or not at all. You may need to drag the split bar between panes or scroll to view content.
NOTE: Each correct selection is worth one point.

DA-100 Analyzing Data with Microsoft Power BI Part 06 Q02 139 Question 
DA-100 Analyzing Data with Microsoft Power BI Part 06 Q02 139 Answer -
You create a dataset sourced from dozens of flat files in Azure Blob storage. The dataset uses incremental refresh.
From powerbi.com, you deploy the dataset and several related reports to Microsoft Power BI Premium capacity.
You discover that the dataset refresh fails after the refresh runs out of resources.
What is a possible cause of the issue?
- Query folding is not occurring.
- You selected Only refresh complete periods.
- The data type of the column used to partition the data changed.
- A filter is missing on the report.
Explanation:The Power BI service partitions data based on date range. This is what enables only certain partitions to be refreshed incrementally. To make this work, the partition filter conditions are pushed down to the source system by including them in the queries. Using Power Query terminology, this is called “query folding”. It is not recommended that incremental refresh is used when the required query folding cannot take place. -
Note: This question is part of a series of questions that present the same scenario. Each question in the series contains a unique solution that might meet the stated goals. Some question sets might have more than one correct solution, while others might not have a correct solution.
After you answer a question in this scenario, you will NOT be able to return to it. As a result, these questions will not appear in the review screen.
You have several reports and dashboards in a workspace.
You need to grant all organizational users read access to a dashboard and several reports.
Solution: You enable included in app for all assets.
Does this meet the goal?
- Yes
- No
-
You publish a Microsoft Power BI dataset to powerbi.com. The dataset appends data from an on-premises Oracle database and an Azure SQL database by using one query.
You have admin access to the workspace and permission to use an existing On-premises data gateway for which the Oracle data source is already configured.
You need to ensure that the data is updated every morning. The solution must minimize configuration effort.
Which two actions should you perform when you configure scheduled refresh? Each correct answer presents part of the solution.
NOTE: Each correct selection is worth one point.
- Configure the dataset to use the existing On-premises data gateway.
- Deploy an On-premises data gateway in personal mode.
- Set the refresh frequency to Daily.
- Configure the dataset to use the personal gateway.
Explanation:B: The on-premises data gateway acts as a bridge to provide quick and secure data transfer between on-premises data (data that isn’t in the cloud) and several Microsoft cloud services. These cloud services include Power BI.
On-premises data gateway (personal mode) allows one user to connect to sources, and can’t be shared with others. An on-premises data gateway (personal mode) can be used only with Power BI. This gateway is well-suited to scenarios where you’re the only person who creates reports, and you don’t need to share any data sources with others.
C: For Power BI users, refreshing data typically means importing data from the original data sources into a dataset, either based on a refresh schedule or on-demand. You can perform multiple dataset refreshes daily, which might be necessary if the underlying source data changes frequently.
Incorrect Answers:
A: On-premises data gateway allows multiple users to connect to multiple on-premises data sources. You can use an on-premises data gateway with all supported services, with a single gateway installation. This gateway is well-suited to complex scenarios with multiple people accessing multiple data sources. -
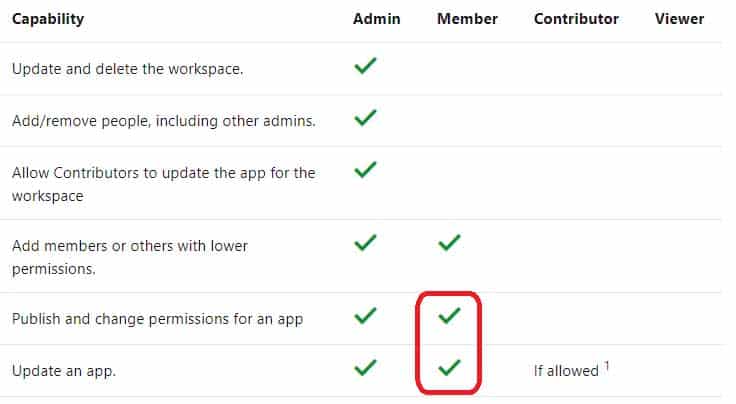
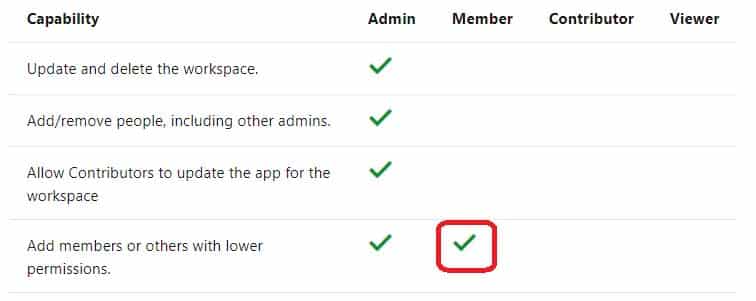
You need to provide a user with the ability to add members to a workspace. The solution must use the principle of least privilege.
Which role should you assign to the user?
- Viewer
- Contributor
- Member
- Admin
-
Note: This question is part of a series of questions that present the same scenario. Each question in the series contains a unique solution that might meet the stated goals. Some question sets might have more than one correct solution, while others might not have a correct solution.
After you answer a question in this scenario, you will NOT be able to return to it. As a result, these questions will not appear in the review screen.
You have several reports and dashboards in a workspace.
You need to grant all organizational users read access to a dashboard and several reports.
Solution: You publish an app to the entire organization.
Does this meet the goal?
- Yes
- No
Explanation:Instead assign all the users the Viewer role to the workspace.
Note: The Viewer role gives a read-only experience to its users. They can view dashboards, reports, or workbooks in the workspace, but can’t browse the datasets or dataflows. Use the Viewer role wherever you would previously use a classic workspace set to “Members can only view Power BI content”.
-
You have multiple dashboards.
You need to ensure that when users browse the available dashboards from powerbi.com, they can see which dashboards contain Personally Identifiable Information (PII). The solution must minimize configuration effort and impact on the dashboard design.
What should you use?
- comments
- tiles
- Microsoft Information Protection sensitivity labels
- Active Directory groups
Explanation:Microsoft Information Protection sensitivity labels provide a simple way for your users to classify critical content in Power BI without compromising productivity or the ability to collaborate.
Sensitivity labels can be applied to datasets, reports, dashboards, and dataflows.
-
You have a Power BI tenant.
You have reports that use financial datasets and are exported as PDF files.
You need to ensure that the reports are encrypted.
What should you implement?
- dataset certifications
- row-level security (RLS)
- sensitivity labels
- Microsoft Intune policies
Explanation:General availability of sensitivity labels in Power BI.
Microsoft Information Protection sensitivity labels provide a simple way for your users to classify critical content in Power BI without compromising productivity or the ability to collaborate. Sensitivity labels can be applied on datasets, reports, dashboards, and dataflows. When data is exported from Power BI to Excel, PowerPoint or PDF files, Power BI automatically applies a sensitivity label on the exported file and protects it according to the label’s file encryption settings. This way your sensitive data remains protected no matter where it is.
-
Your company plans to completely separate development and production assets such as datasets, reports, and dashboards in Microsoft Power BI.
You need to recommend an application lifecycle strategy. The solution must minimize access to production assets and prevent end users from viewing the development assets.
What should you recommend?
- Create production reports in a separate workspace that uses a shared dataset from the development workspace. Grant the end users access to the production workspace.
- Create one workspace for development. From the new workspace, publish an app for production.
- Create a workspace for development and a workspace for production. From the production workspace, publish an app.
- In one workspace, create separate copies of the assets and append DEV to the names of the copied assets. Grant the end users access to the workspace.
Explanation:Use different work stages (Development, Test, and Production).
Deploy from the Development workspace.
-
You have a collection of reports for the HR department of your company. The datasets use row-level security (RLS). The company has multiple sales regions that each has an HR manager.
You need to ensure that the HR managers can interact with the data from their region only. The HR managers must be prevented from changing the layout of the reports.
How should you provision access to the reports for the HR managers?
- Publish the reports to a different workspace other than the one hosting the datasets.
- Publish the reports in an app and grant the HR managers access permission.
- Add the HR managers as members of the existing workspace that hosts the reports and the datasets.
- Create a new workspace, copy the datasets and reports, and add the HR managers as members of the workspace.
Explanation:Note: Row-level security (RLS) with Power BI can be used to restrict data access for given users. Filters restrict data access at the row level, and you can define filters within roles. In the Power BI service, members of a workspace have access to datasets in the workspace. RLS doesn’t restrict this data access. -
You create a report by using Microsoft Power BI Desktop.
The report uses data from a Microsoft SQL Server Analysis Services (SSAS) cube located on your company’s internal network.
You plan to publish the report to the Power BI Service.
What should you implement to ensure that users who consume the report from the Power BI Service have the most up-to-date data from the cube?
- a subscription
- a scheduled refresh of the dataset
- an OData feed
- an On-premises data gateway
Explanation:When you’ve created dynamic reports in Power BI Desktop, you can share them by publishing to your Power BI site. When you publish a Power BI Desktop file with a live connection to a tabular model to your Power BI site, an on-premises data gateway must be installed and configured by an administrator. -
Note: This question is part of a series of questions that present the same scenario. Each question in the series contains a unique solution that might meet the stated goals. Some question sets might have more than one correct solution, while others might not have a correct solution.
After you answer a question in this scenario, you will NOT be able to return to it. As a result, these questions will not appear in the review screen.
You have several reports and dashboards in a workspace.
You need to grant all organizational users read access to a dashboard and several reports.
Solution: You create an Azure Active Directory group that contains all the users. You share each report and dashboard to the group.
Does this meet the goal?
- Yes
- No
Explanation:Instead assign all the users the Viewer role to the workspace.
Note: The Viewer role gives a read-only experience to its users. They can view dashboards, reports, or workbooks in the workspace, but can’t browse the datasets or dataflows. Use the Viewer role wherever you would previously use a classic workspace set to “Members can only view Power BI content”.
-
Note: This question is part of a series of questions that present the same scenario. Each question in the series contains a unique solution that might meet the stated goals. Some question sets might have more than one correct solution, while others might not have a correct solution.
After you answer a question in this scenario, you will NOT be able to return to it. As a result, these questions will not appear in the review screen.
You have several reports and dashboards in a workspace.
You need to grant all organizational users read access to a dashboard and several reports.
Solution: You assign all the users the Viewer role to the workspace.
Does this meet the goal?
- Yes
- No
Explanation:The Viewer role gives a read-only experience to its users. They can view dashboards, reports, or workbooks in the workspace, but can’t browse the datasets or dataflows. Use the Viewer role wherever you would previously use a classic workspace set to “Members can only view Power BI content”. -
You are building a Power BI report to analyze customer segments.
You need to identify customer segments dynamically based on the Bounce Rate across dimensions such as source, geography, and demographics. The solution must minimize analysis effort.
Which type of visualization should you use?
- funnel chart
- key influencers
- Q&A
- decomposition tree
Explanation:The key influencers visual is a great choice if you want to:
See which factors affect the metric being analyzed.
Contrast the relative importance of these factors. For example, do short-term contracts affect churn more than long-term contracts?Note: The key influencers visual helps you understand the factors that drive a metric you’re interested in. It analyzes your data, ranks the factors that matter, and displays them as key influencers. For example, suppose you want to figure out what influences employee turnover, which is also known as churn. One factor might be employment contract length, and another factor might be commute time.
Incorrect Answers:
A: A funnel chart helps you visualize a linear process that has sequential connected stages. For example, a sales funnel that tracks customers through stages: Lead > Qualified Lead > Prospect > Contract > Close. At a glance, the shape of the funnel conveys the health of the process you’re tracking.C: Use Q&A to explore your data using intuitive, natural language capabilities and receive answers in the form of charts and graphs. Q&A is different from a search engine — Q&A only provides results about the data in Power BI.
D: The decomposition tree visual in Power BI lets you visualize data across multiple dimensions. It automatically aggregates data and enables drilling down into your dimensions in any order. It is also an artificial intelligence (AI) visualization, so you can ask it to find the next dimension to drill down into based on certain criteria. This makes it a valuable tool for ad hoc exploration and conducting root cause analysis.
