PL-100 : Microsoft Power Platform App Maker : Part 06
-
HOTSPOT
You are creating a Power Automate flow.
You have an array that contains items with different color attributes. You plan to filter the array by using the following filter expression within the flow:
@or(equals(item()?['color'], 'red'),contains(item()?['color'],'blue'))The filter returns results only when the expression resolves to true.
For each of the following statements, select Yes if the statement is true. Otherwise, select No.
NOTE: Each correct selection is worth one point.

PL-100 Microsoft Power Platform App Maker Part 06 Q01 046 Question 
PL-100 Microsoft Power Platform App Maker Part 06 Q01 046 Answer Explanation:Box 1: No
Box 2: Yes
The item color must be red, or item color contains blue.Box 3: Yes
-
You create and publish a canvas app component library to perform complex calculations.
You discover an error in one of the calculations. You correct the issue and publish the component library. A co-worker uses the original version of the component library in a canvas app.
You need to ensure that the co-worker uses the updated version of the component library.
What should you do?
- Export the updated component library and instruct the co-worker to import the updated version into the canvas app
- Inform the co-worker to edit the canvas app and manually add the updated version of the component library
- Instruct the co-worker to edit the canvas app and update the component library
Explanation:You can modify an existing component library and save any changes with additional version notes. However, the updated component library version must be published for use in existing apps that use the component library.
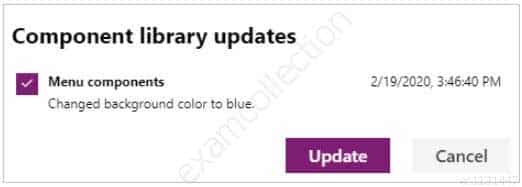
Makers of other apps are notified of updated components being available. The notification appears when makers edit the apps in canvas app studio. They can choose to update the components:
PL-100 Microsoft Power Platform App Maker Part 06 Q02 047 Select Review, and you’ll see the option to update the component:
-
You are creating a canvas app. You plan to use variables that are scoped to a screen to store values.
You need to create and update the value of the variables.
Which three functions can you use? Each correct answer presents a complete solution.
NOTE: Each correct selection is worth one point.
- Collect
- Patch
- Navigate
- Set
- UpdateContext
Explanation:B: Use the Patch function to modify records in complex situations. Such as, when you do updates that require no user interaction or use forms that span multiple screens.
CE: Context variables are scoped for Screen. They are great for passing values to a screen, much like parameters to a procedure in other languages. Can be referenced from only one screen.
Functions available for context variables:
– UpdateContext
– NavigateNote:
Use the UpdateContext function to create a context variable, which temporarily holds a piece of information, such as the number of times the user has selected a button or the result of a data operation.Context variables are also preserved when a user navigates between screens. You can use Navigate to set one or more context variables for the screen that the formula will display, which is the only way to set a context variable from outside the screen.
-
DRAG DROP
You have a model-driven app that has an entity named Marinas. You have an entity named Boats that list the boats associated with each marina.
You must add a list of boats to the Marinas form. You must also add an option for users to select different views including boat owners and marina members.
You need to embed the list of boats associated with a Marina record in the entity form.
In which order should you perform the actions? To answer, move all actions from the list of actions to the answer area and arrange them in the correct order.
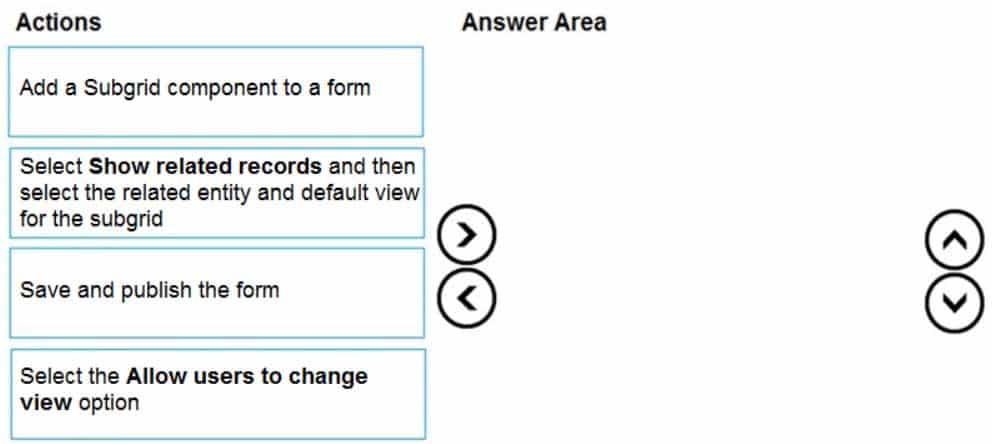
PL-100 Microsoft Power Platform App Maker Part 06 Q04 049 Question 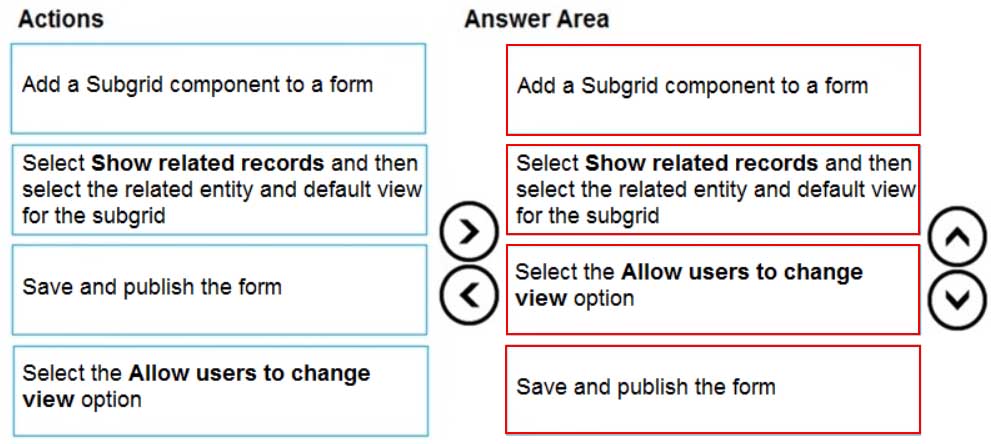
PL-100 Microsoft Power Platform App Maker Part 06 Q04 049 Answer Explanation:Step 1: Add a Subgrid component to a form
You add a subgrid component the same way as you add any other component.Step 2: Select Show related records and then select the related entity and default view for the subgrid
Configure a subgrid component.
Properties available to configure when using a subgrid component on a form using the form designer include:
– Show related rows
– When selected, the subgrid displays only rows related to the current row that is displayed on the form.Step 3: Select the Allow users to change view option
Configure a subgrid component.
Properties available to configure when using a subgrid component on a form using the form designer include:
– Allow users to change view
When selected, app users can change from the Default view to another view of the table selected in the Table property.Step 4: Save and publish the form
-
DRAG DROP
You create the following apps for a company that provides financial guidance services: a model-driven app for financial advisers that work in the company’s offices and a canvas app for remote financial advisers.
You need to create business rules for a custom counselling entity used by all financial advisers.
Who will be affected by the business rules?
To answer, drag the appropriate financial adviser types to the correct business rules. Each financial adviser type may be used once, more than once, or not at all. You may need to drag the split bat between panes or scroll to view content.
NOTE: Each correct selection is worth one point.

PL-100 Microsoft Power Platform App Maker Part 06 Q05 050 Question 
PL-100 Microsoft Power Platform App Maker Part 06 Q05 050 Answer Explanation:Box 1: Office-based and remote financial advisers
Model driven apps can use all actions available on business rules, however not all business rule actions are available for canvas apps at this time.Box 2: Office-based financial advisers only
If you’re building a Canvas app, you must use table as the scope (not All forms, not a specific form)Box 3: Office-based financial advisers only
The following actions are not available on Canvas apps :– Show or hide columns
– Enable or disable columns
– Create business recommendations based on business intelligence. -
HOTSPOT
You need to store a list of products and their colors. You have a Power Apps app that includes the following elements:
– a text box for the product name
– a drop-down list for the product color
– a button to add a product to the list
– a status message that shows whether the addition of a product to the list was successfulThe button uses the following formula:
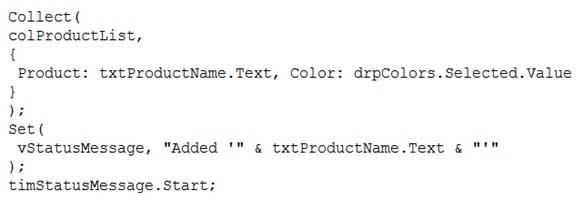
PL-100 Microsoft Power Platform App Maker Part 06 Q06 051 For each of the following statements, select Yes if the statement is true. Otherwise, select No.
NOTE: Each correct selection is worth one point.

PL-100 Microsoft Power Platform App Maker Part 06 Q06 052 Question 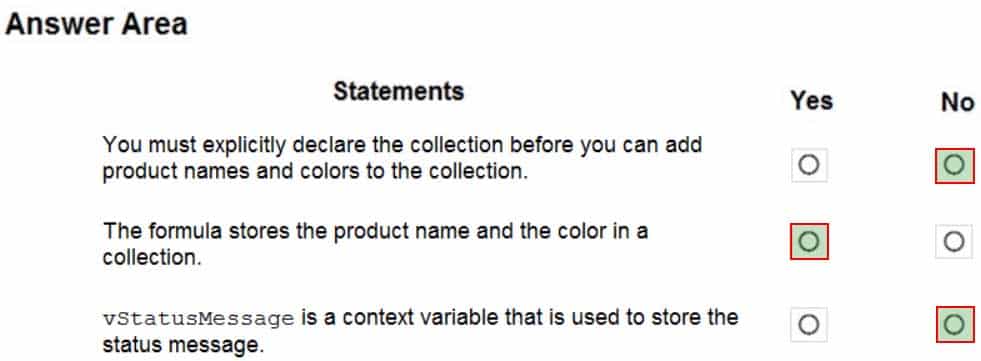
PL-100 Microsoft Power Platform App Maker Part 06 Q06 052 Answer Explanation:Box 1: No
The Collect function adds records to a data source. If the data source doesn’t already exist, a collection is created.Box 2: Yes
Box 3: No
Use the Set function to set the value of a global variable, which temporarily holds a piece of information, such as the number of times the user has selected a button or the result of a data operation. -
You are creating a canvas app.
You need to store and retrieve small amounts of data on a local device when the app is offline.
Which set of functions should you use?
- SaveData, LoadData
- Set, Patch
- Patch, Collect
- Set, Collect
Explanation:
LoadData and SaveData combine to form a simple mechanism to store small amounts of data on a local device. By using these functions, you can add simple offline capabilities to your app. -
You are creating a canvas app.
You need to display a limited list of choices to the end user. You must standardize the values and appearance of the list across all forms.
Which two actions should you perform? Each correct answer presents part of the solution.
NOTE: Each correct selection is worth one point.
- Add a drop-down field in the app
- Create a Global Option Set
- Add a new business rule
- Add a component to the component library
Explanation:
A global Option Set can be shared across entities. -
DRAG DROP
A company must use a Power Apps app custom control that is exported from a different canvas Power Apps app.
You need to insert the custom control into the Power Apps app.
Where should you complete the actions? To answer, drag the appropriate locations to the correct actions. Each location may be used once, more than once, or not at all. You may need to drag the split bar between panes or scroll to view content.
NOTE: Each correct selection is worth one point.

PL-100 Microsoft Power Platform App Maker Part 06 Q09 053 Question 
PL-100 Microsoft Power Platform App Maker Part 06 Q09 053 Answer Explanation:Box 1: Components
1. To add code components to a canvas app:
2. Navigate to Power Apps Studio.
3. Create a new canvas app or edit an existing app to which you want to add the code component.
4. Go to Insert > Custom > Import component.
PL-100 Microsoft Power Platform App Maker Part 06 Q09 054 Box 2: Display
-
Note: This question is part of a series of questions that present the same scenario. Each question in the series contains a unique solution that might meet the stated goals. Some question sets might have more than one correct solution, while others might not have a correct solution.
After you answer a question in this section, you will NOT be able to return to it. As a result, these questions will not appear in the review screen.
A company has locations in multiple countries and regions across four continents.
The company stores the total amount of each order in the local currency of the country/region where the customer is located. The company stores the applicable exchange rates in a custom US dollars (USD) exchange rate table.
You need to create a visualization that displays the total amount of orders by country/region in USD.
Proposed solution:
Create a custom column that converts the order total to USD by using the relationship between order local currency and the USD exchange rate table in Power BI Desktop and display this column in a Power BI chart by country/region.
Does the solution meet the goal?
- Yes
- No
Explanation:
Instead use a calculated field.
Need to calculate the exchange rate in USD.
Calculated columns are calculated in real-time when they are retrieved. -
Note: This question is part of a series of questions that present the same scenario. Each question in the series contains a unique solution that might meet the stated goals. Some question sets might have more than one correct solution, while others might not have a correct solution.
After you answer a question in this section, you will NOT be able to return to it. As a result, these questions will not appear in the review screen.
A company has locations in multiple countries and regions across four continents.
The company stores the total amount of each order in the local currency of the country/region where the customer is located. The company stores the applicable exchange rates in a custom US dollars (USD) exchange rate table.
You need to create a visualization that displays the total amount of orders by country/region in USD.
Proposed solution:
Create a custom rollup field of type currency on the country/region table that aggregates all the total amounts for the orders from that country/region and display this rollup field in a Power BI chart.
Does the solution meet the goal?
- Yes
- No
Explanation:
Instead use a calculated field.
Need to calculate the exchange rate in USD.
Calculated columns are calculated in real-time when they are retrieved. -
Note: This question is part of a series of questions that present the same scenario. Each question in the series contains a unique solution that might meet the stated goals. Some question sets might have more than one correct solution, while others might not have a correct solution.
After you answer a question in this section, you will NOT be able to return to it. As a result, these questions will not appear in the review screen.
A company has locations in multiple countries and regions across four continents.
The company stores the total amount of each order in the local currency of the country/region where the customer is located. The company stores the applicable exchange rates in a custom US dollars (USD) exchange rate table.
You need to create a visualization that displays the total amount of orders by country/region in USD.
Proposed solution:
Create a custom calculated field of type currency on the order table that converts the order total to USD and displays the total amounts by region in a Power BI chart.
Does the solution meet the goal?
- Yes
- No
Explanation:
Instead use a calculated field.
Need to calculate the exchange rate in USD.
Calculated columns are calculated in real-time when they are retrieved. -
HOTSPOT
A company is building a Power Apps app to track key project tasks.
Users assign tasks a risk status on a scale of 0 to 100 by using a slider input control named RiskStatus on the app. The highest risks use the risk status value of 100.
For each task, the user selects a button named RiskLevel to send the name of the task and RiskStatus number to key project stakeholders. The color of the button must change to the color listed in the following table based on the value of the RiskStatus control. The default color for the button is green.

PL-100 Microsoft Power Platform App Maker Part 06 Q13 055 You need to configure the solution to change the color of the RiskLevel button.
How should you configure the app? To answer, select the appropriate options in the answer area.
NOTE: Each correct selection is worth one point.
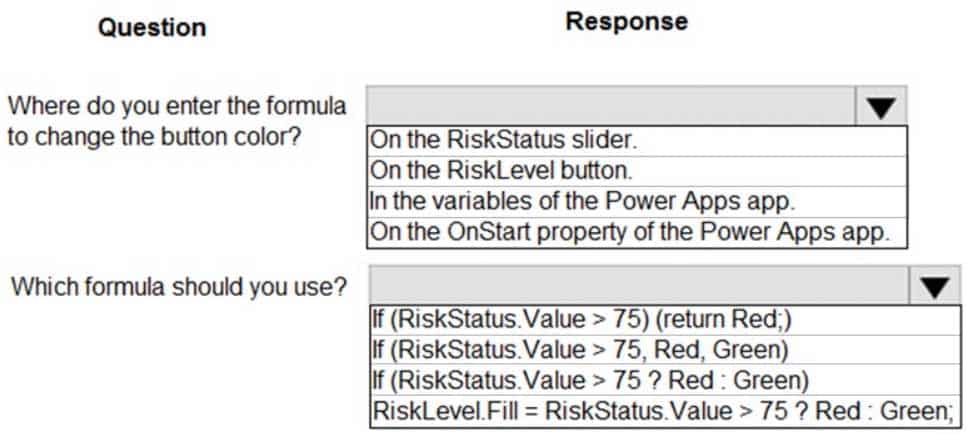
PL-100 Microsoft Power Platform App Maker Part 06 Q13 056 Question 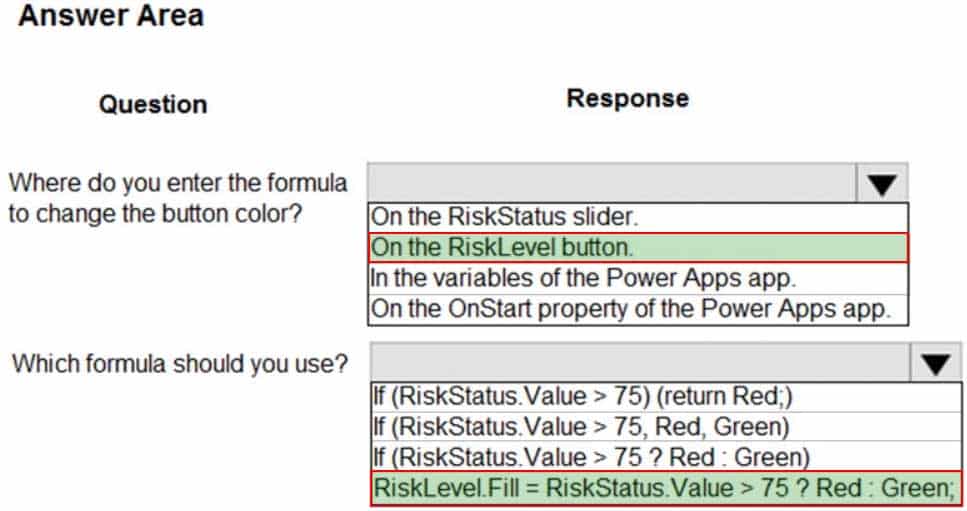
PL-100 Microsoft Power Platform App Maker Part 06 Q13 056 Answer Explanation:Box 1: On the RiskLevel button.
On the RiskLevel button fill property.Box 2: Risklevel.Fill = RiskStatus.Value > 75 ? Red : Green;
Most every type of control in a Power App, has a Fill property, for the fill color. -
HOTSPOT
A company creates a Power Apps app that allows service representatives to record information about on-site client visits. Service representatives perform a one-hour site visit with each client each quarter.
Service representatives use the app to perform the following activities:
– View their scheduled visits for the day.
– Record notes from service visits.
– Schedule service technicians for issues uncovered during site visits.
– Scan and upload service quote forms to a folder named Service Quote folder on Microsoft OneDrive once the customer has signed a service quote.Service quotes that are over $10,000 are automatically sent to the service manager for review and approval.
Visits that are not closed at the end of the day are automatically moved to the following day unless it is the last day of the quarter. All client visits not performed for the quarter are escalated to the service manager for follow-up.
You need to create flows to meet the requirements.
Which type of flows should you use? To answer, select the appropriate options in the answer area.
NOTE: Each correct selection is worth one point.
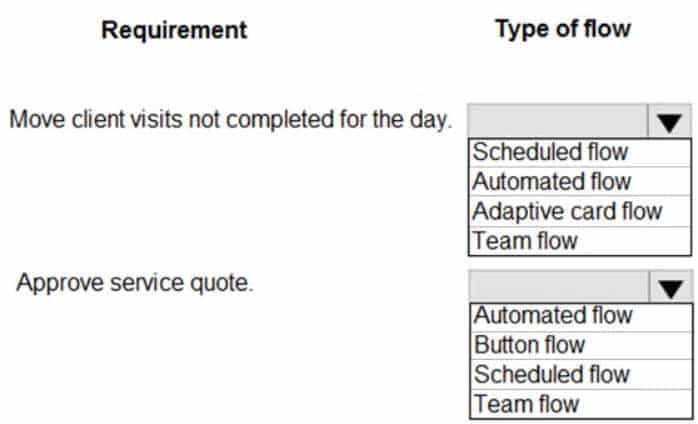
PL-100 Microsoft Power Platform App Maker Part 06 Q14 057 Question 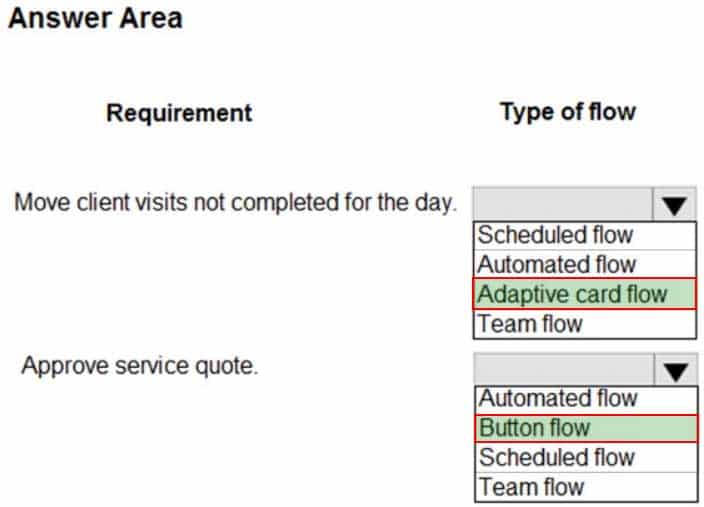
PL-100 Microsoft Power Platform App Maker Part 06 Q14 057 Answer Explanation:Box 1: Adaptive card flow
Adaptive Cards are a platform-agnostic method of sharing and displaying blocks of information without the complexity of customizing CSS or HTML to render them.Directing content to Teams channels:
Post your own adaptive card as the Flow bot to a channel
This action posts an adaptive card as a Flow bot to a specific Teams channel. In this case, you will be prompted for Teams instance, and a channel where the card will be posted. The flow-maker will have to have access to the Teams instance in order to post an adaptive card there. In this case, only URL buttons function by redirecting to the URL configured within the flow.Box 2: Button flow
Create a button flow to run routine tasks by simply tapping a button. Customize your flow by allowing the user to provide specific details that will be used when the flow runs. -
You complete work on a new canvas app in a development environment and add the app to a solution. You export the solution from the development environment and import the solution into a production environment.
After several days you notice that the background color for the canvas app in the production environment has changed from white to gray.
You need to determine why the background color changed.
What are two possible causes for the background color change? Each correct answer presents a complete solution.
NOTE: Each correct selection is worth one point.
- You recently changed the Office 365 theme.
- You exported a managed copy of the solution and imported the solution as an unmanaged solution. You modified the canvas app in the unmanaged solution.
- You exported and imported an unmanaged copy of the solution and a co-worker modified the canvas app.
- You chose a different theme from the Theme menu inside the canvas app.
Explanation:A: You can create a custom look and feel (a theme), for your app by making changes to the default colors and visual elements provided in the uncustomized system.
C: Unmanaged Solution: The beginning state of solution is the unmanaged solution state. During this phase, you can add, edit, update, remove, delete, and test any of the components of the solution. You also have the ability to create restrictions on the components within the solution.
Note: Managed Solution: A managed solution is a finalized solution that can be distributed and installed. They are created by exporting an unmanaged solution by setting restrictions to prevent any further customizations. The whole point of Managed is locking down the Component states so they cannot be edited.
-
DRAG DROP
You create a canvas app for a store.
The logo must appear as the background image for the app. A loading spinner must display on the screen as the app loads.
You need to add the features to the app.
What should you modify? To answer, drag the appropriate form areas to the correct requests. Each form area may be used once, more than once, or not at all. You may need to drag the split bar between panes or scroll to view content.
NOTE: Each correct selection is worth one point.
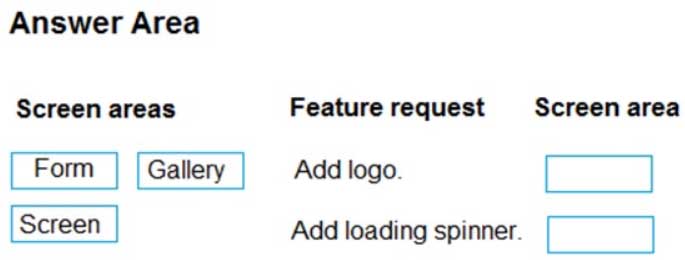
PL-100 Microsoft Power Platform App Maker Part 06 Q16 058 Question 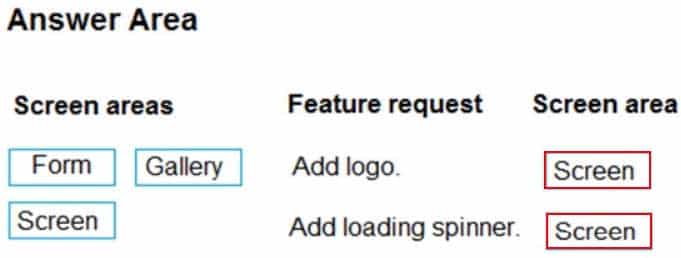
PL-100 Microsoft Power Platform App Maker Part 06 Q16 058 Answer Explanation:Box 1: Screen
You can add an image to a screen in several different ways. One way is to upload an image to the app, go to the Media tab, and then click on the image to add it to a screen.Note: Configure graphical elements in your app, including images, photos, and elements of a pen control.
Background Image – The name of an image file that appears in the background of a screen.
Applies to the Screen control.
Box 2: Screen
Out Of Box Canvas App, provide a property called Loading Spinner and Loading Spinner Color.Loading Spinner property is used to displaying a Canvas App OOB Loader Image unless your screen finishes loading.
Click on the Screen in your Canvas App and then You’ll be able to see Loading Spinner and Loading Spinner Color Property.
-
You have a Power Automate flow that processes files in a Microsoft SharePoint document library. The flow only needs to be run as required. You add steps to the flow to process the files.
Before leaving the office for the day, the manager must initiate the flow. The flow must not start processing files before 11:00 PM.
You need to configure the flow.
Which two actions should you perform? Each correct answer presents part of the solution.
NOTE: Each correct selection is worth one point.
- Add a recurrence trigger and configure to run daily at 11:00 PM.
- Add a Condition action. If the time greater than 11:00 PM use a Terminate action prevent further processing.
- Manually trigger the flow.
- Add a Delay Until action and enter the timestamp for 11:00 PM.
Explanation:Delay an action until a specific timestamp.
Note: The Microsoft Dataverse connector provides four ways to add wait conditions. Use these wait conditions when you need to delay processing in your flows until a particular condition is met.
– Postpone triggering the flow and the first action until a specific time: Wait condition using Postpone Until.
– Add a fixed delay before the next step.
– Delay an action until a specific timestamp.
– Delay an action until a specific event occurs. -
DRAG DROP
You are creating a model-driven app for onboarding new employees.
You need to implement business logic for the app.
Which tool should you use? To answer, drag the appropriate tools to the correct requirements. Each tool may be used once, more than once, or not at all. You may need to drag the split bar between panes or scroll to view content.
NOTE: Each correct selection is worth one point.

PL-100 Microsoft Power Platform App Maker Part 06 Q18 059 Question 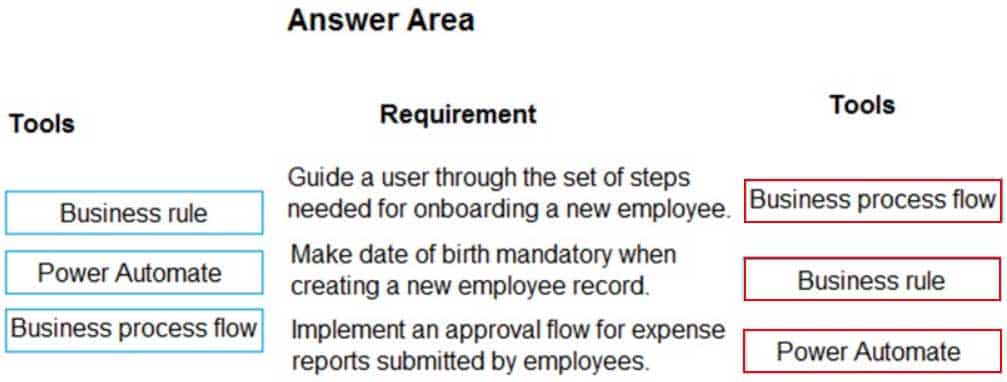
PL-100 Microsoft Power Platform App Maker Part 06 Q18 059 Answer Explanation:Box 1: Business process flow
A business process flow is a visual guide meant to help users complete a business process by using a set of predefined stages. Users are not limited on how long they run a business process or how long they have a stage open.Box 2: Business rule
Box 3: Power Automate
A Power Automate flow does not have any visual components like a business process flow. Power Automate flows can be configured to work with many different data sources, and a flow can connect to many different data sources within the same flow. A flow can be configured to time out if it is not completed in a certain time and can be triggered to move between steps based on data or user interaction. -
HOTSPOT
You create a canvas app for a service company.
Using the Tree view, you navigate to the ViewServices screen. The screen contains a form named DetailForm1 that only contains Label controls. You add the People icon to the header of the ViewServices screen as shown below:
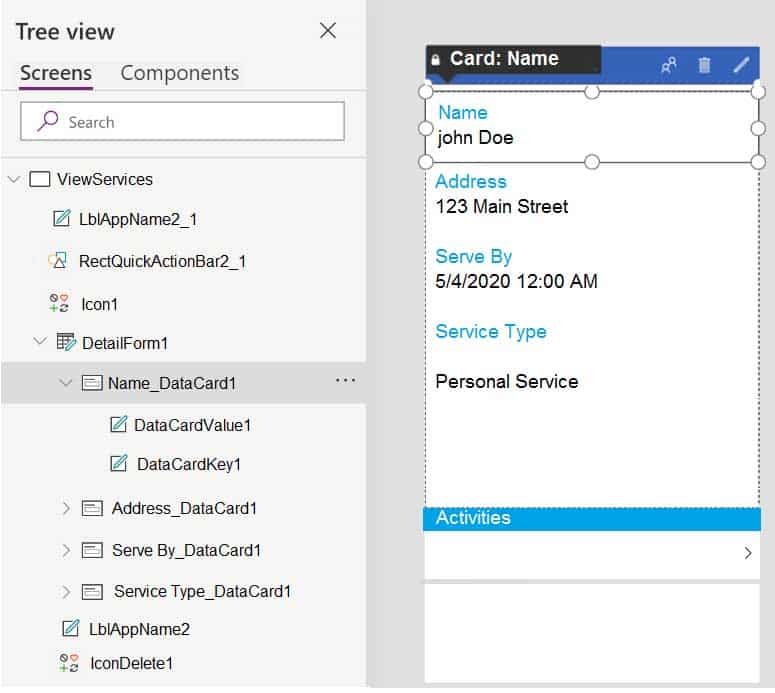
PL-100 Microsoft Power Platform App Maker Part 06 Q19 060 When you select the icon a new Activity form opens. You must set the value of the Name field on the new Activity form to the value of the name field from DetailForm1.
Use the drop-down menus to select the answer choice that answers each question based on the information presented in the graphic.
NOTE: Each correct selection is worth one point.
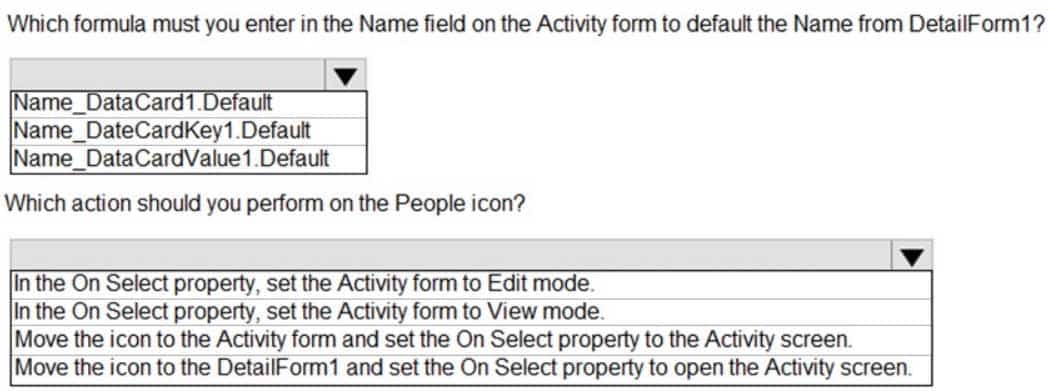
PL-100 Microsoft Power Platform App Maker Part 06 Q19 061 Question 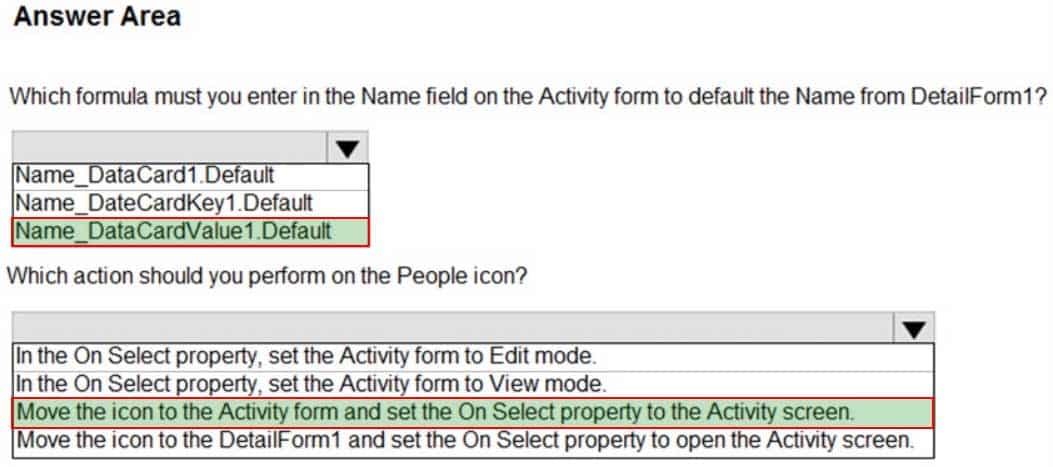
PL-100 Microsoft Power Platform App Maker Part 06 Q19 061 Answer Explanation:Box 1: Name_DataCardValue1.Default
Box 2: Move the icon to the Activity form and set the On Select property to the Activity screen.
The Select function simulates a select action on a control as if the user had clicked or tapped the control. As a result, the OnSelect formula on the target control is evaluated. -
You are creating a canvas app for a company that delivers packages. The app will display one screen for each delivery attempt.
Drivers must make three attempts to deliver a package before returning the package back to a warehouse. Drivers must enter details about delivery on a second screen in the app.
You need to display a list of delivery attempts on the delivery screen.
Which two components can you add to the app to display details about the delivery attempts? Each correct answer presents a complete solution.
NOTE: Each correct selection is worth one point.
- Data table
- Vertical gallery
- Display form
- Drop-down
Explanation::The Data table control shows a dataset.
In a canvas app, add and configure a Display form control to show all fields in a record.
